
Rent prices by Dutch city
Median rent, rent per square metre and rank for every covered city, filterable by name or province.
Browse cities by marketThe city with the lowest advertised rent is not automatically the cheapest place to rent: a low asking rent often reflects smaller advertised homes. Order the covered Dutch cities by median advertised rent, then switch to cost per square metre and watch the order change. Typical rental size, new-listing supply and how quickly homes leave complete the comparison. Only cities carrying enough represented listings appear, so each column stays a like-for-like reading rather than a headline drawn from a handful of homes.
For rent, rent per square metre, home size, new supply and market speed: the covered city at the favourable end, the city at the other end, and the median across all covered cities in between. Every name opens that city's full rental market overview.
Figures rebuilt October 10, 2026 from advertised listings collected across Dutch rental platforms; every city view and ranking is refreshed daily.
Choose which cities to compare — every covered city, the big cities, university cities or the Randstad — then the measure. The field sits on one axis from cheapest to priciest, the cities at either end are listed in colour, and the complete ranked list with search opens on request.
The middle advertised asking rent across listings collected for each city over the last three months. Half of what is advertised sits above it and half below, which makes it far more stable than an average when a handful of luxury or student listings enter the sample.
Set the cheapest cities by headline rent beside the cheapest by cost per square metre. Where a city appears on one list and not the other, the difference is floor area, not affordability.
Lowest monthly asking rent among the covered cities
Lowest cost per square metre among the covered cities
Every figure describes advertised asking rents in listings Luntero collects from Dutch rental platforms, not signed contracts, social housing allocations or the complete local housing stock.
Direct answers with the current figures behind this comparison. Each one links the reader on to the city or measure it names.
Open that city's full market overview for its trend windows and listing composition, or jump straight to the homes advertised there and check whether the comparison holds up against what is actually available.
Median rent, rent per square metre and rank for every covered city, filterable by name or province.
Browse cities by marketMedian and average asking rent, price per square meter, time on market, supply volume and the rest of the indicator library.
Browse metricsFind a metric, report or city view by name, unit or topic across everything Luntero publishes about the rental market.
Search market dataHave an idea for a new housing market chart, dataset, or analysis? Submit your request and help shape the next generation of Luntero’s rental market insights. Whether it’s a new metric, city comparison, or visualization, your input helps us expand coverage of Dutch housing trends and create data tools that serve renters, investors, and researchers across the Netherlands.
Explore the latest properties added to Luntero. Find new apartments, houses, and studios across the Netherlands — updated daily to help you discover your next home faster.
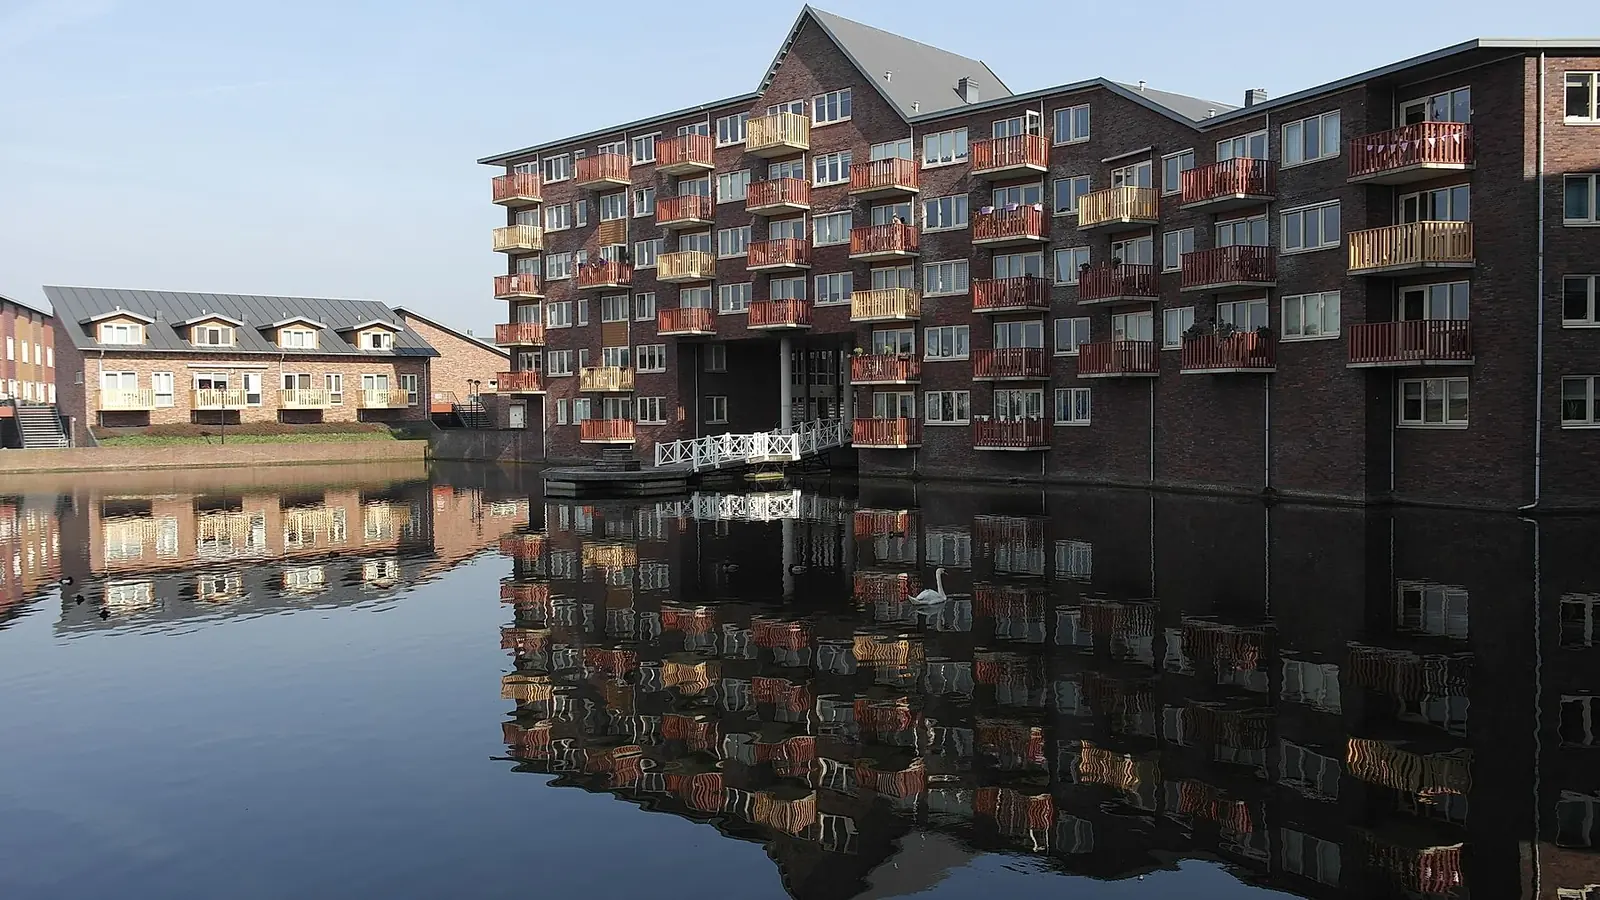
€1,192.00 / month
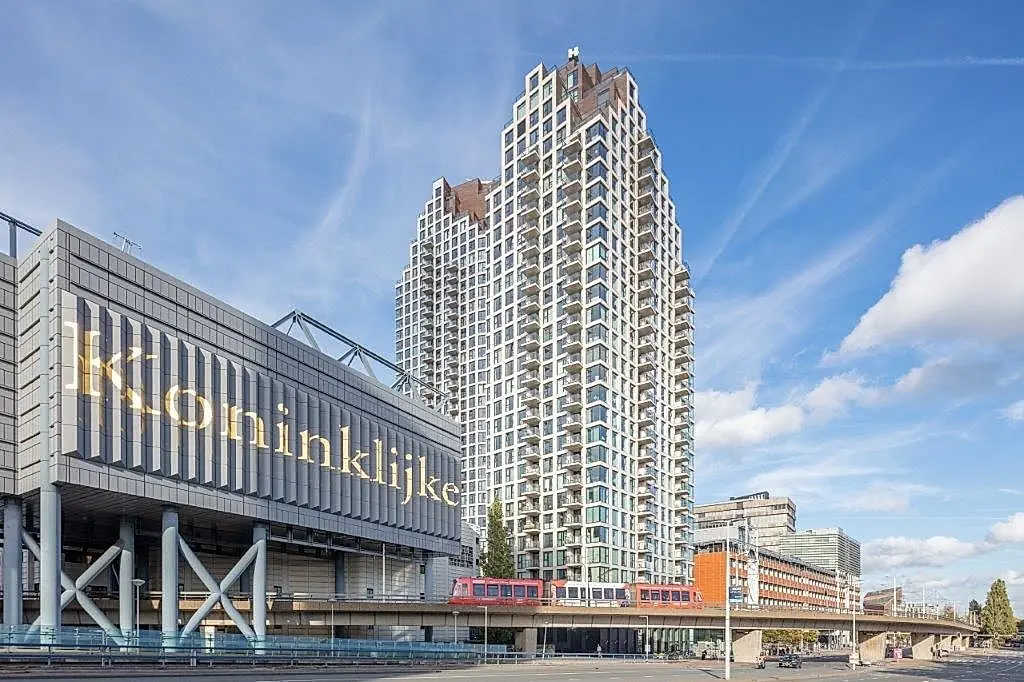
€1,552.00 / month
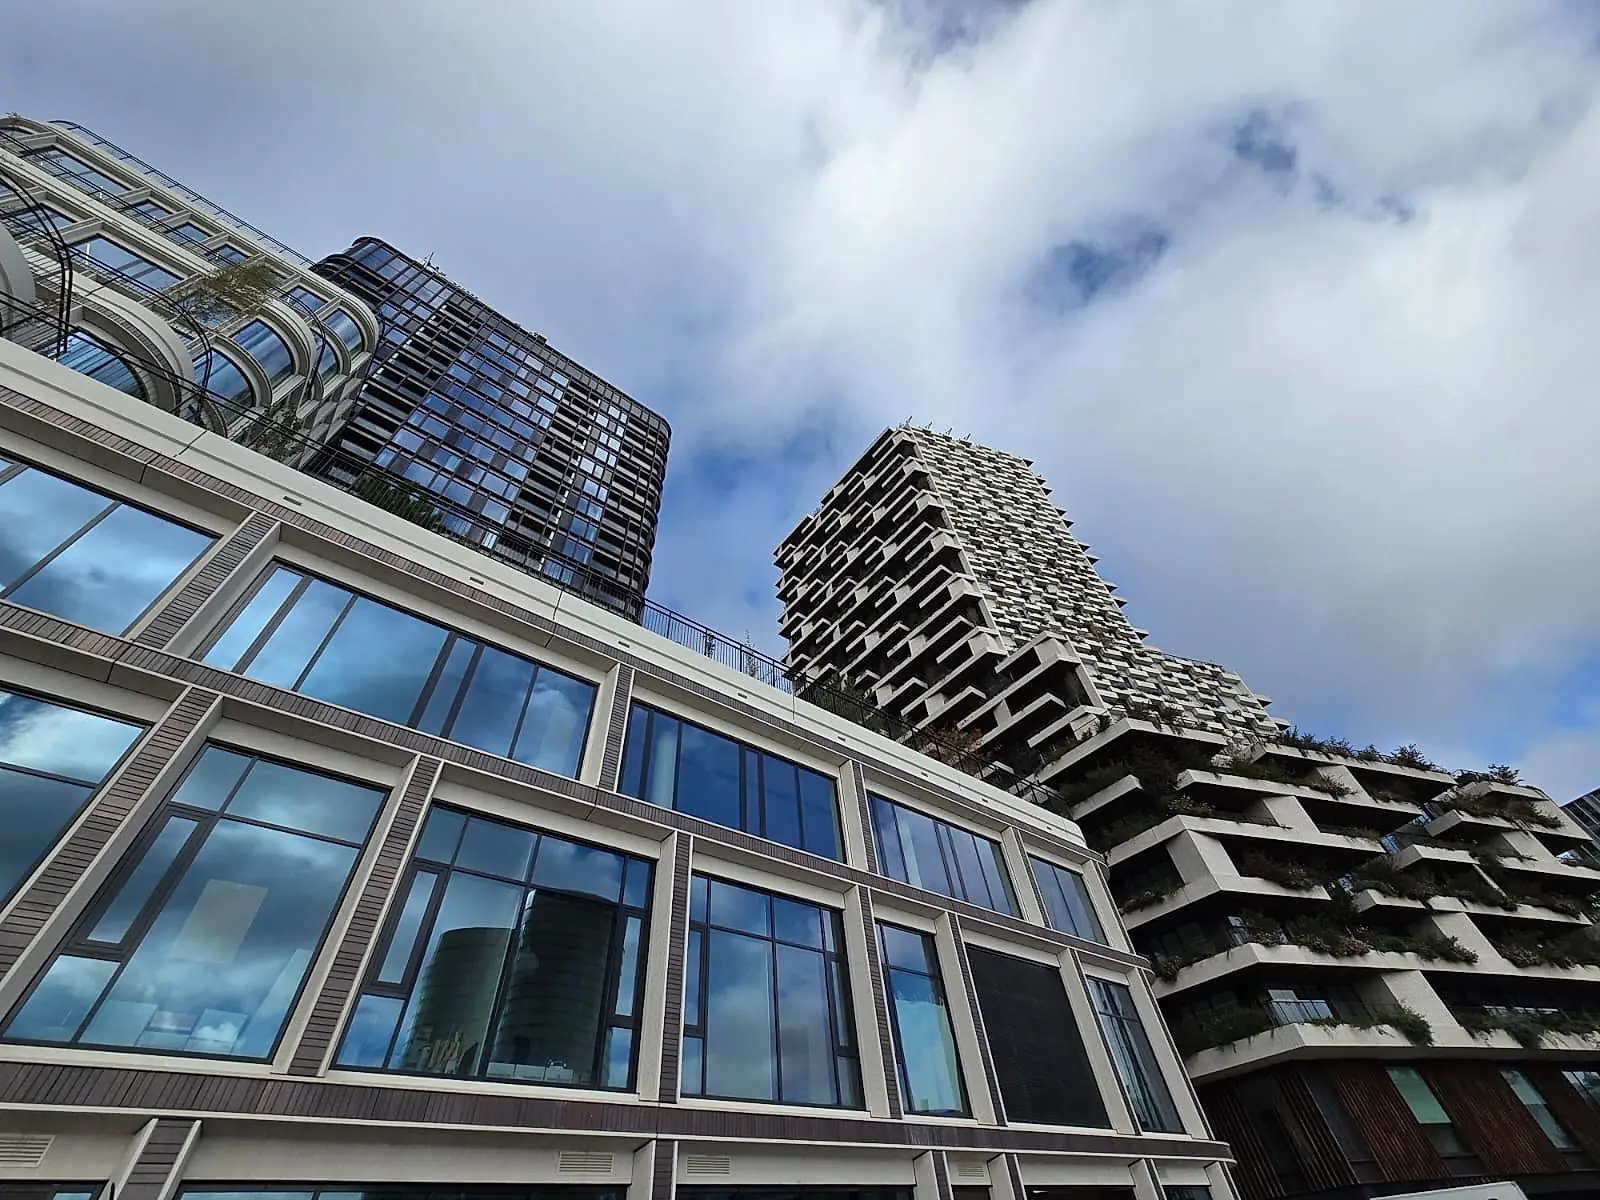
€1,612.00 / month
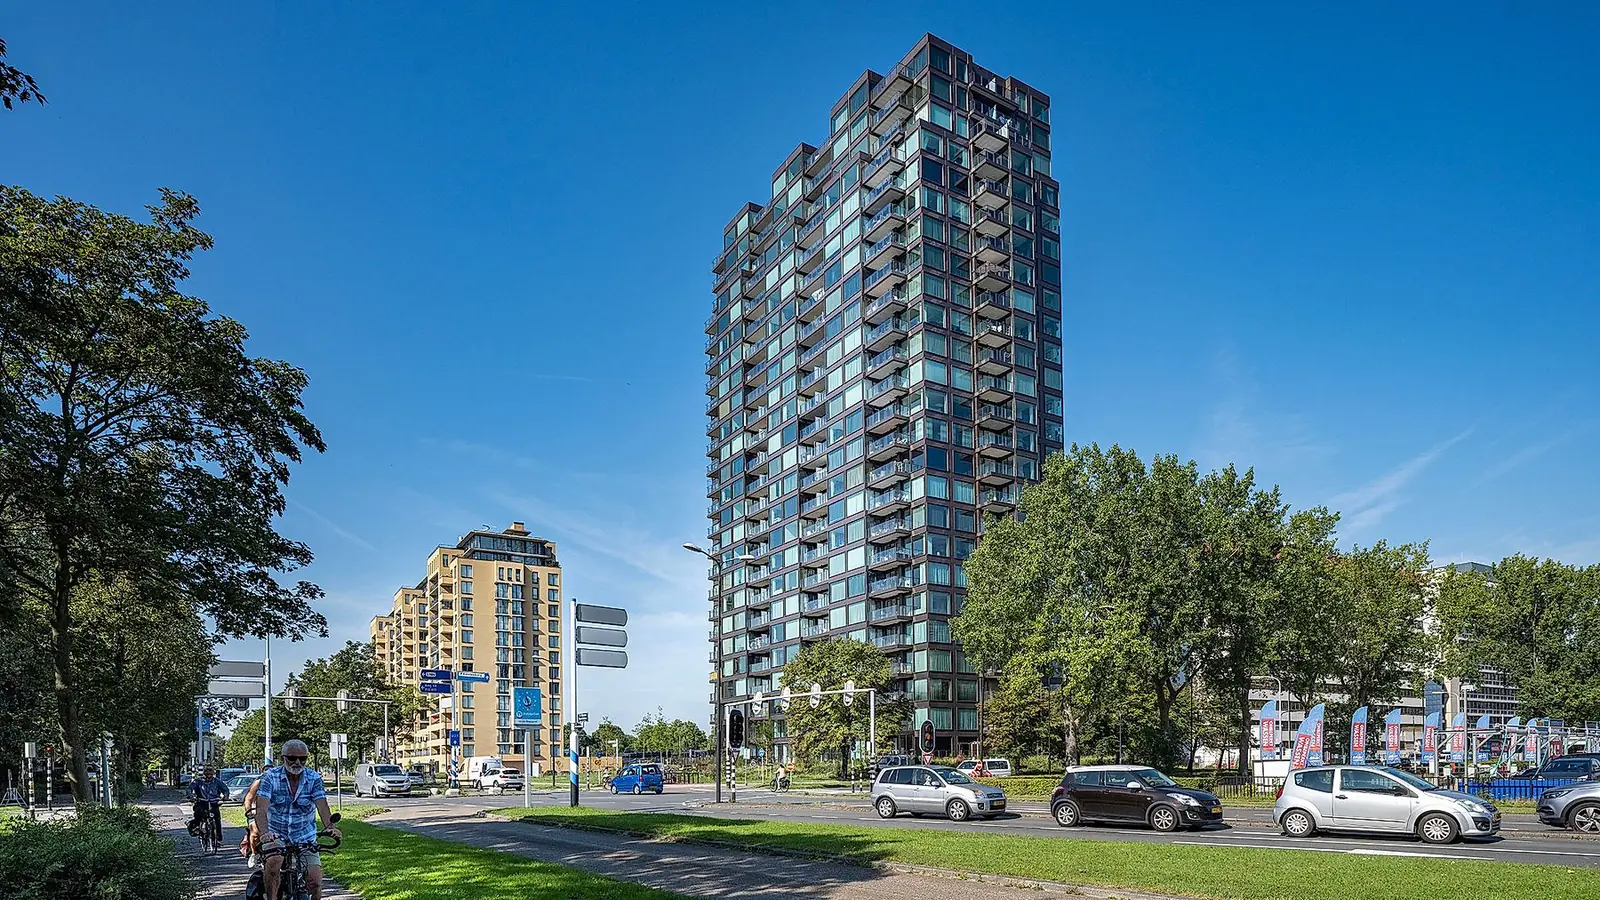
€1,601.00 / month
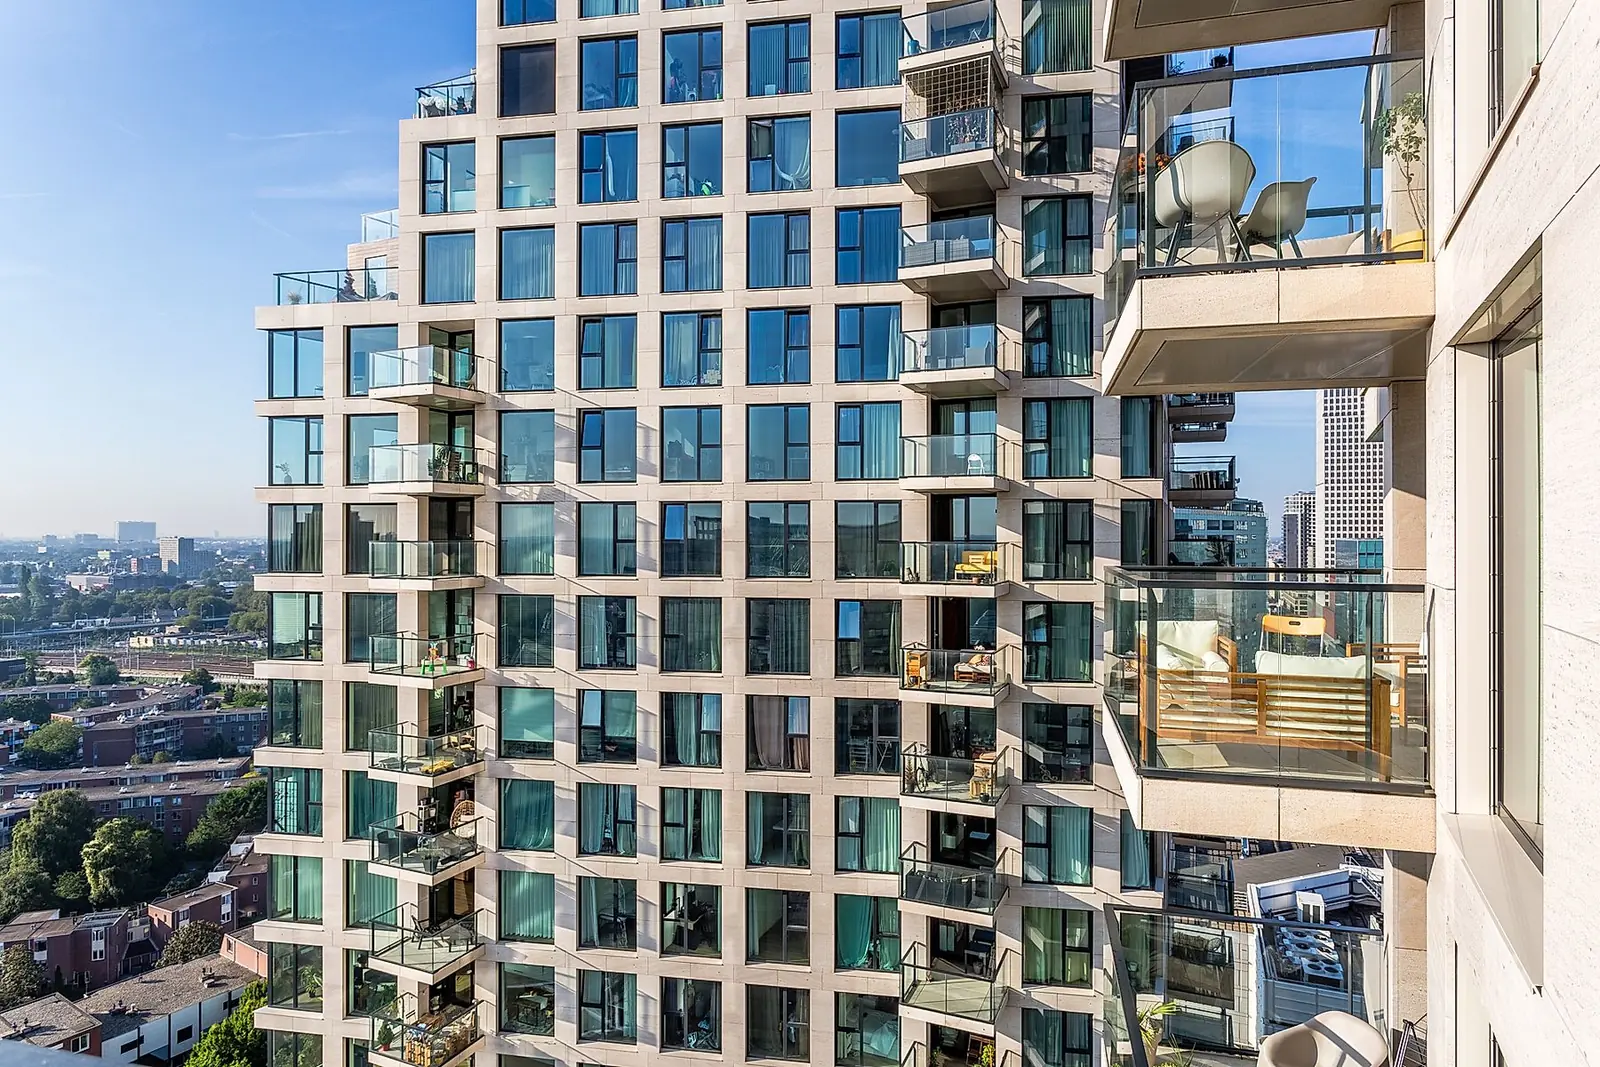
€1,186.00 / month
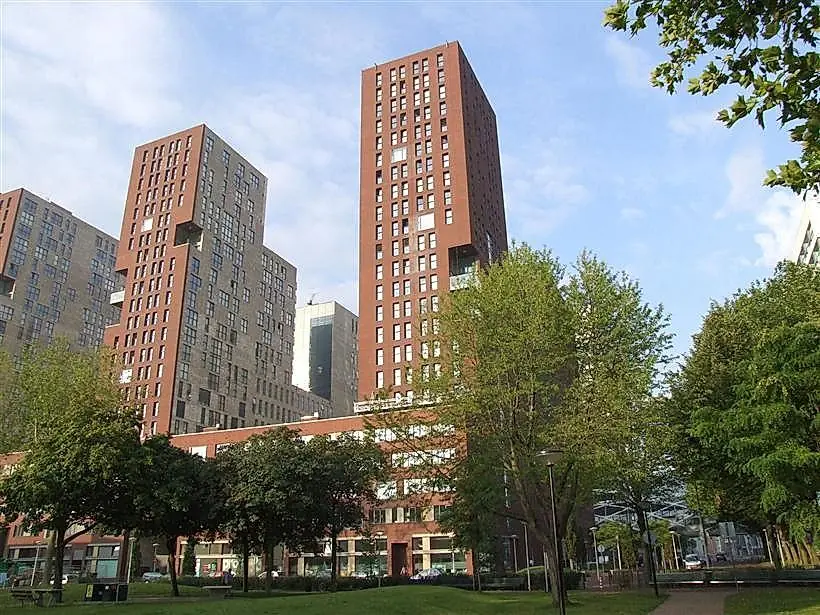
€1,993.00 / month
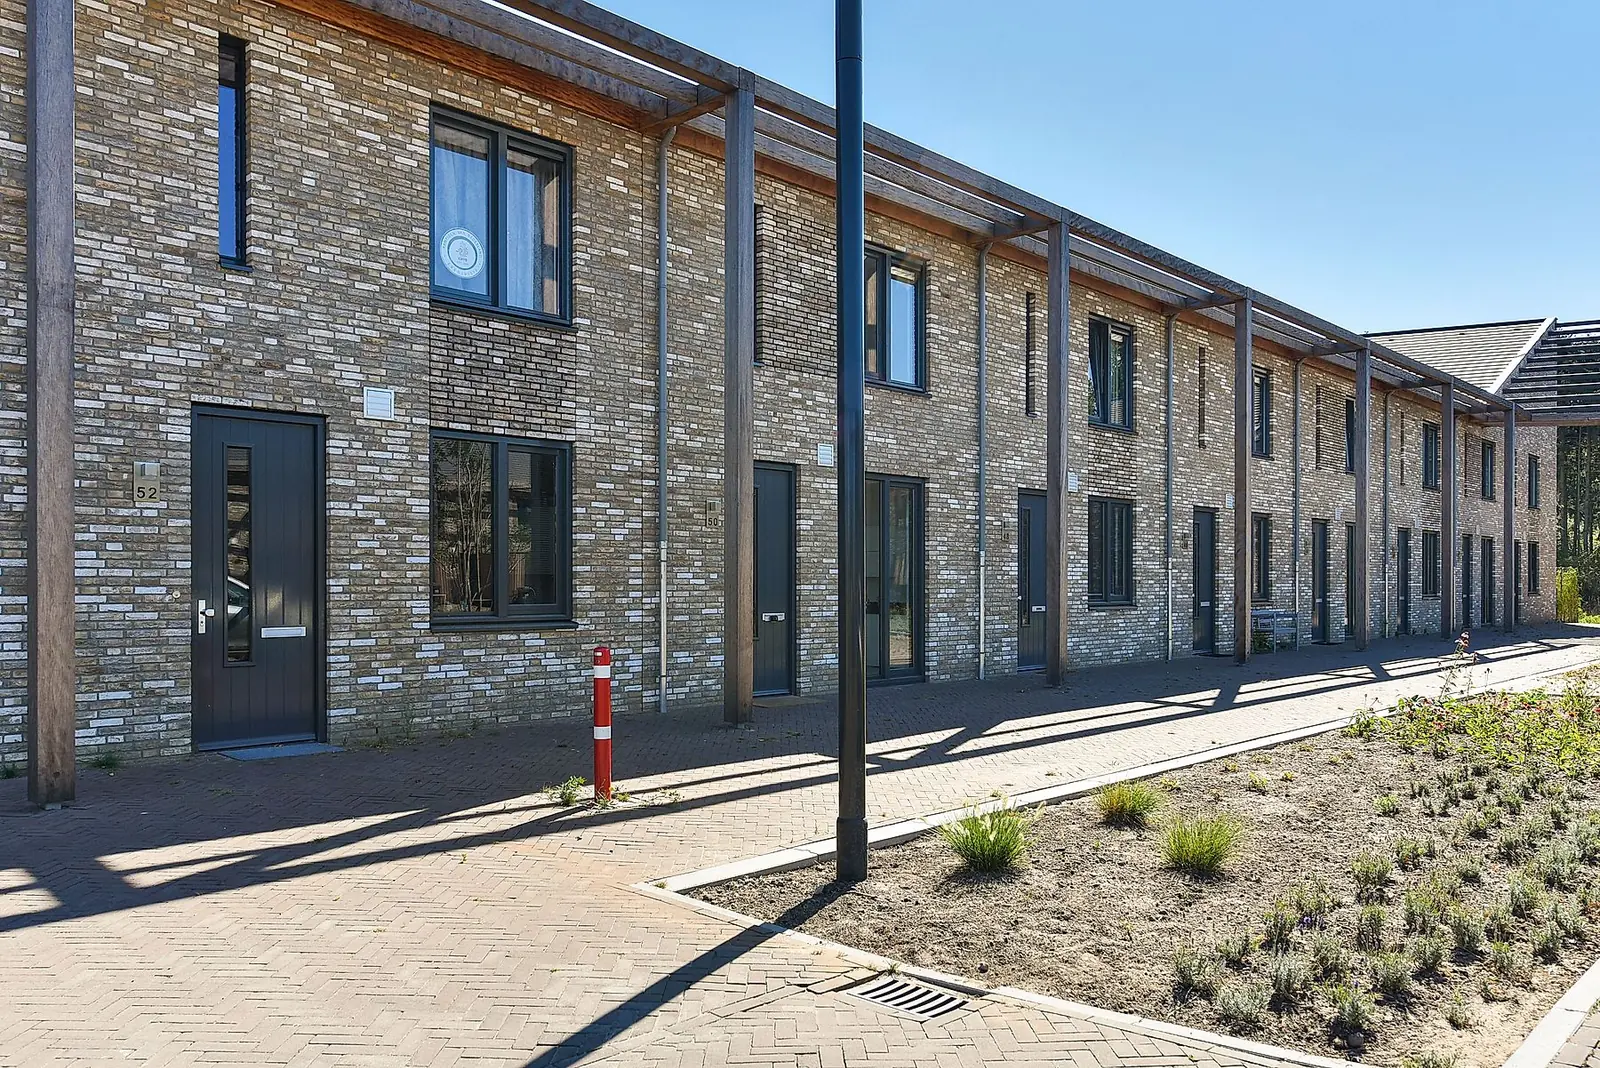
€1,455.00 / month
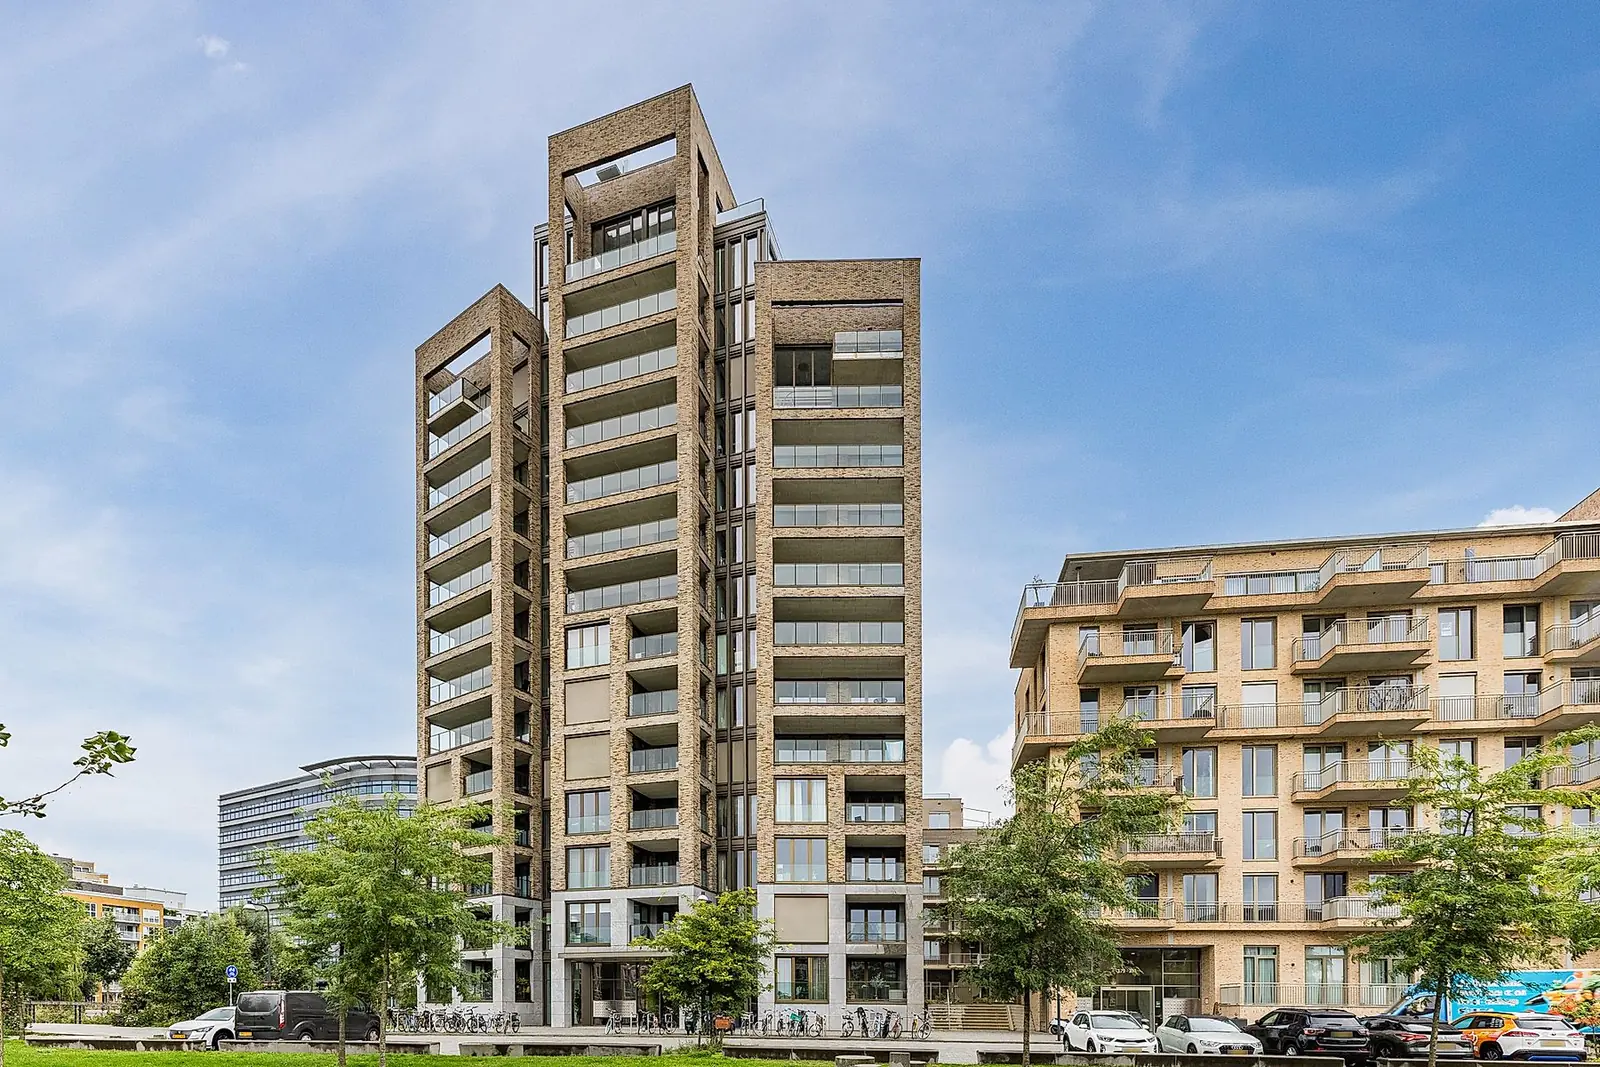
€2,111.00 / month
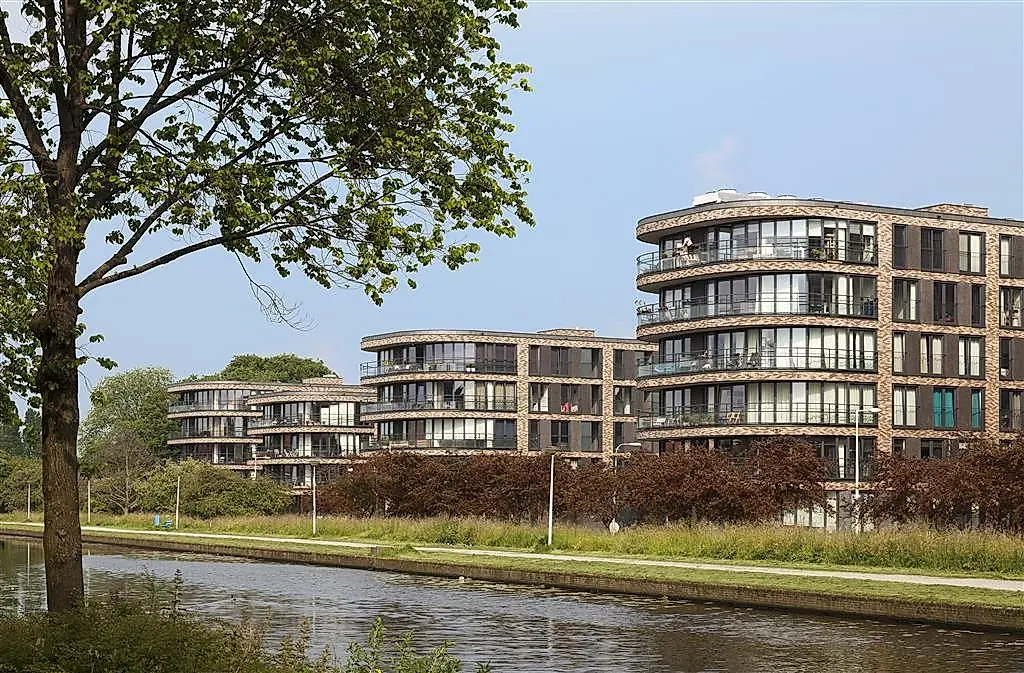
€2,129.00 / month
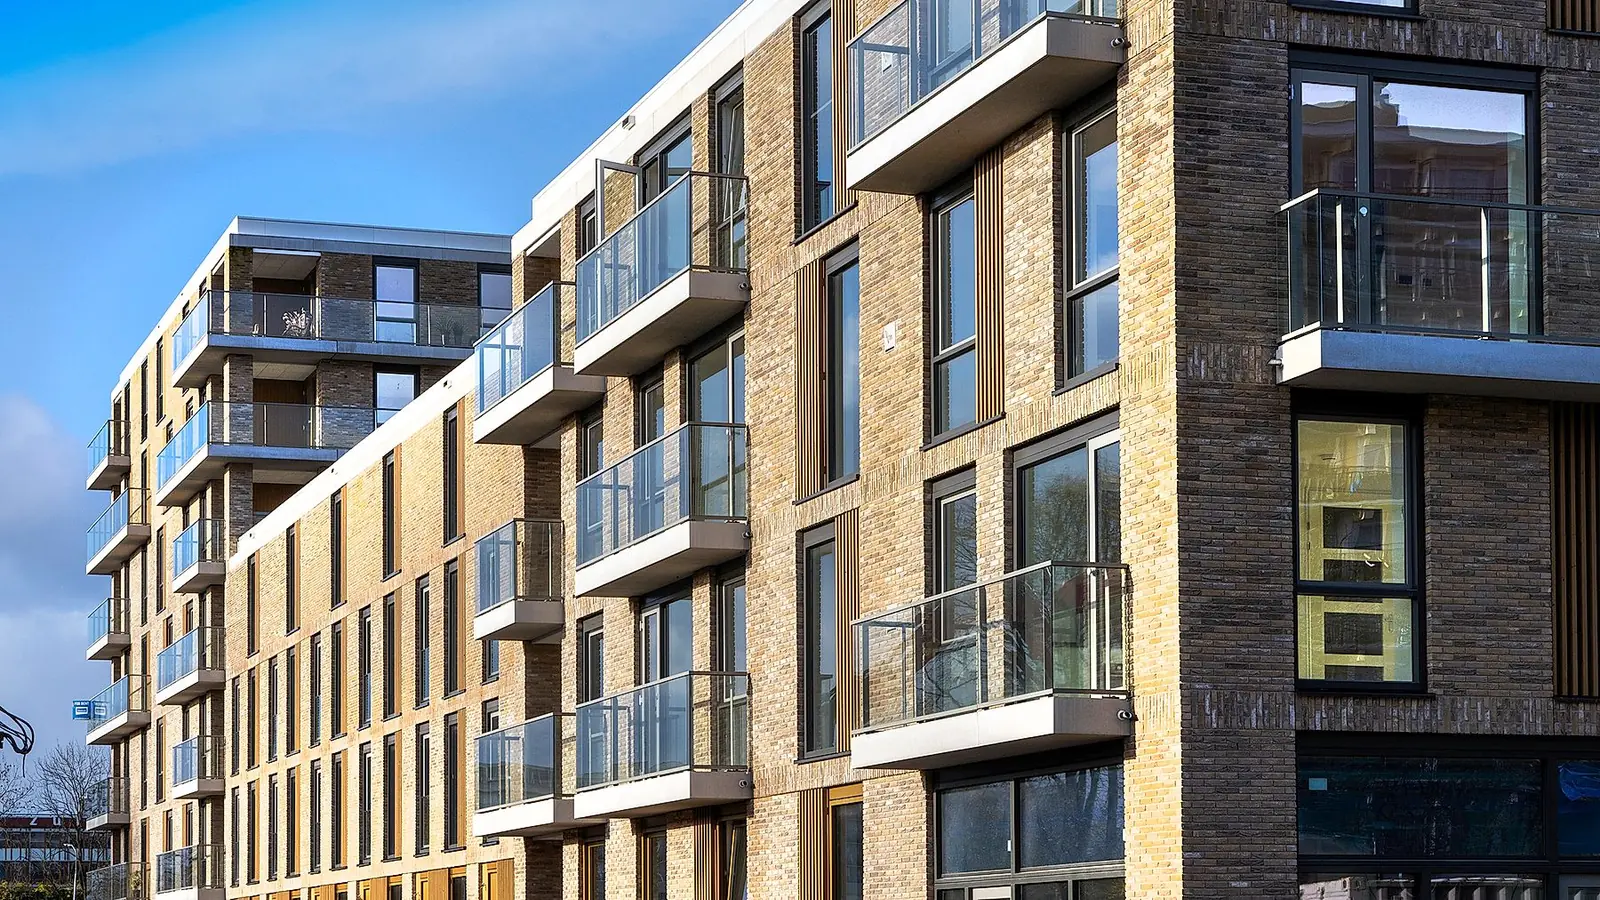
€1,549.00 / month
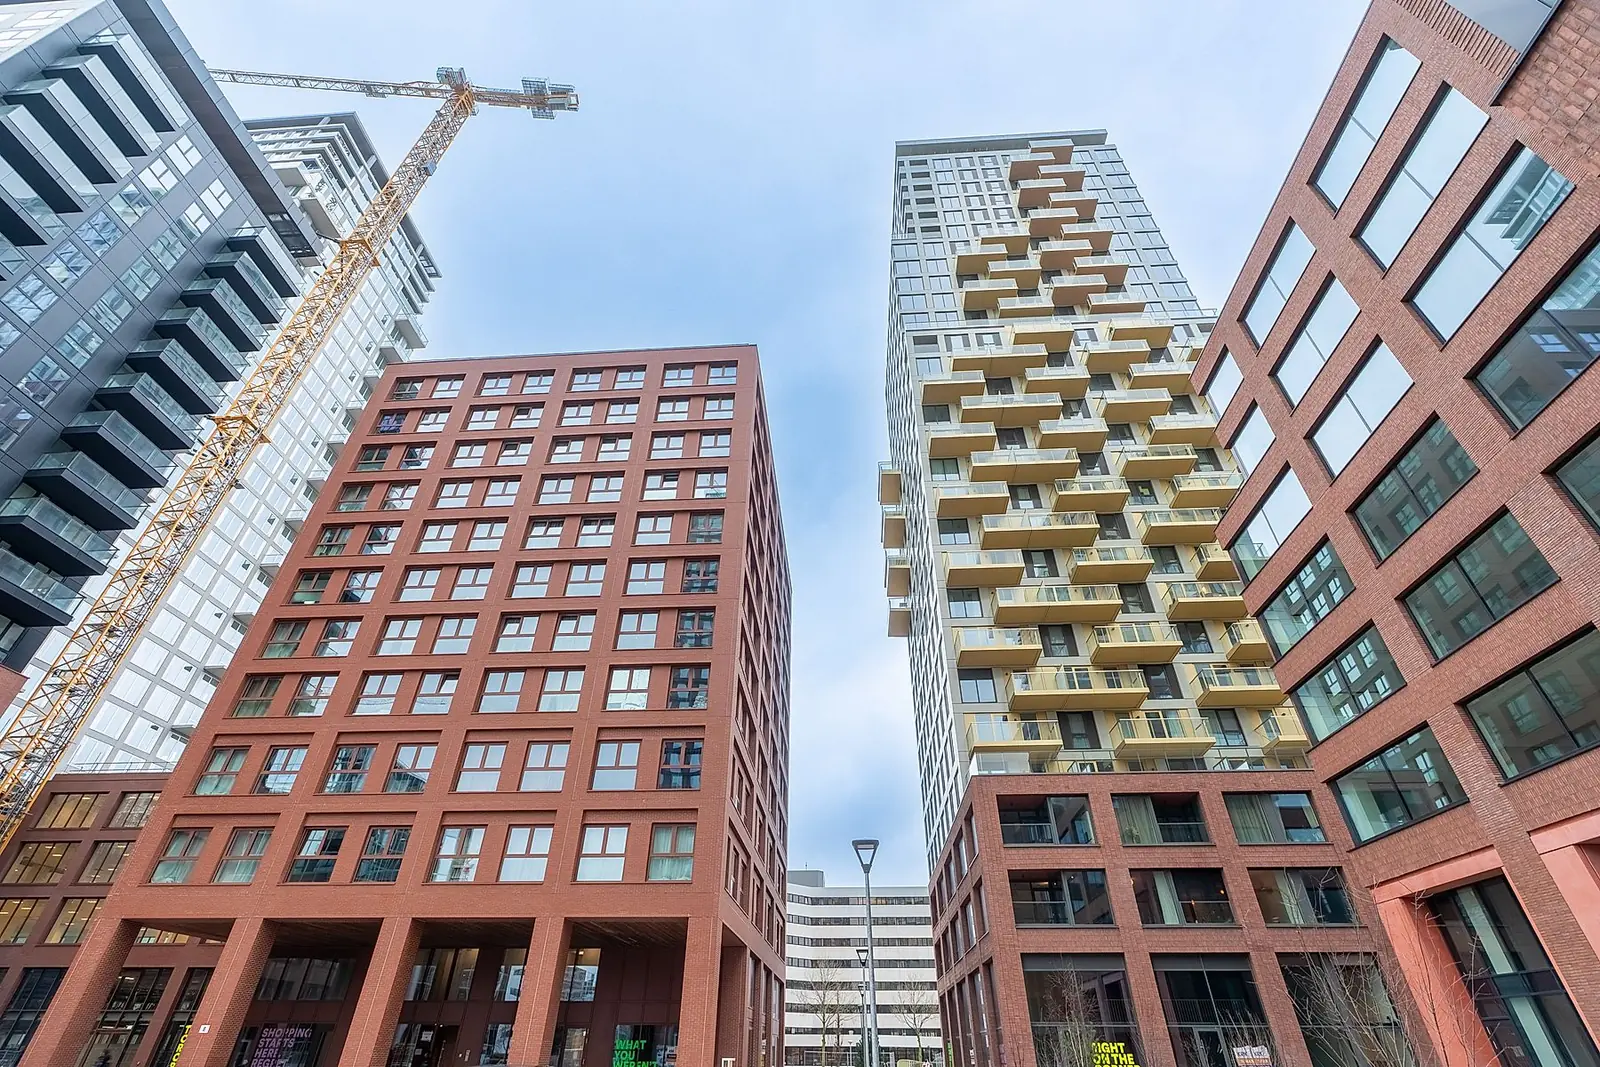
€1,303.00 / month
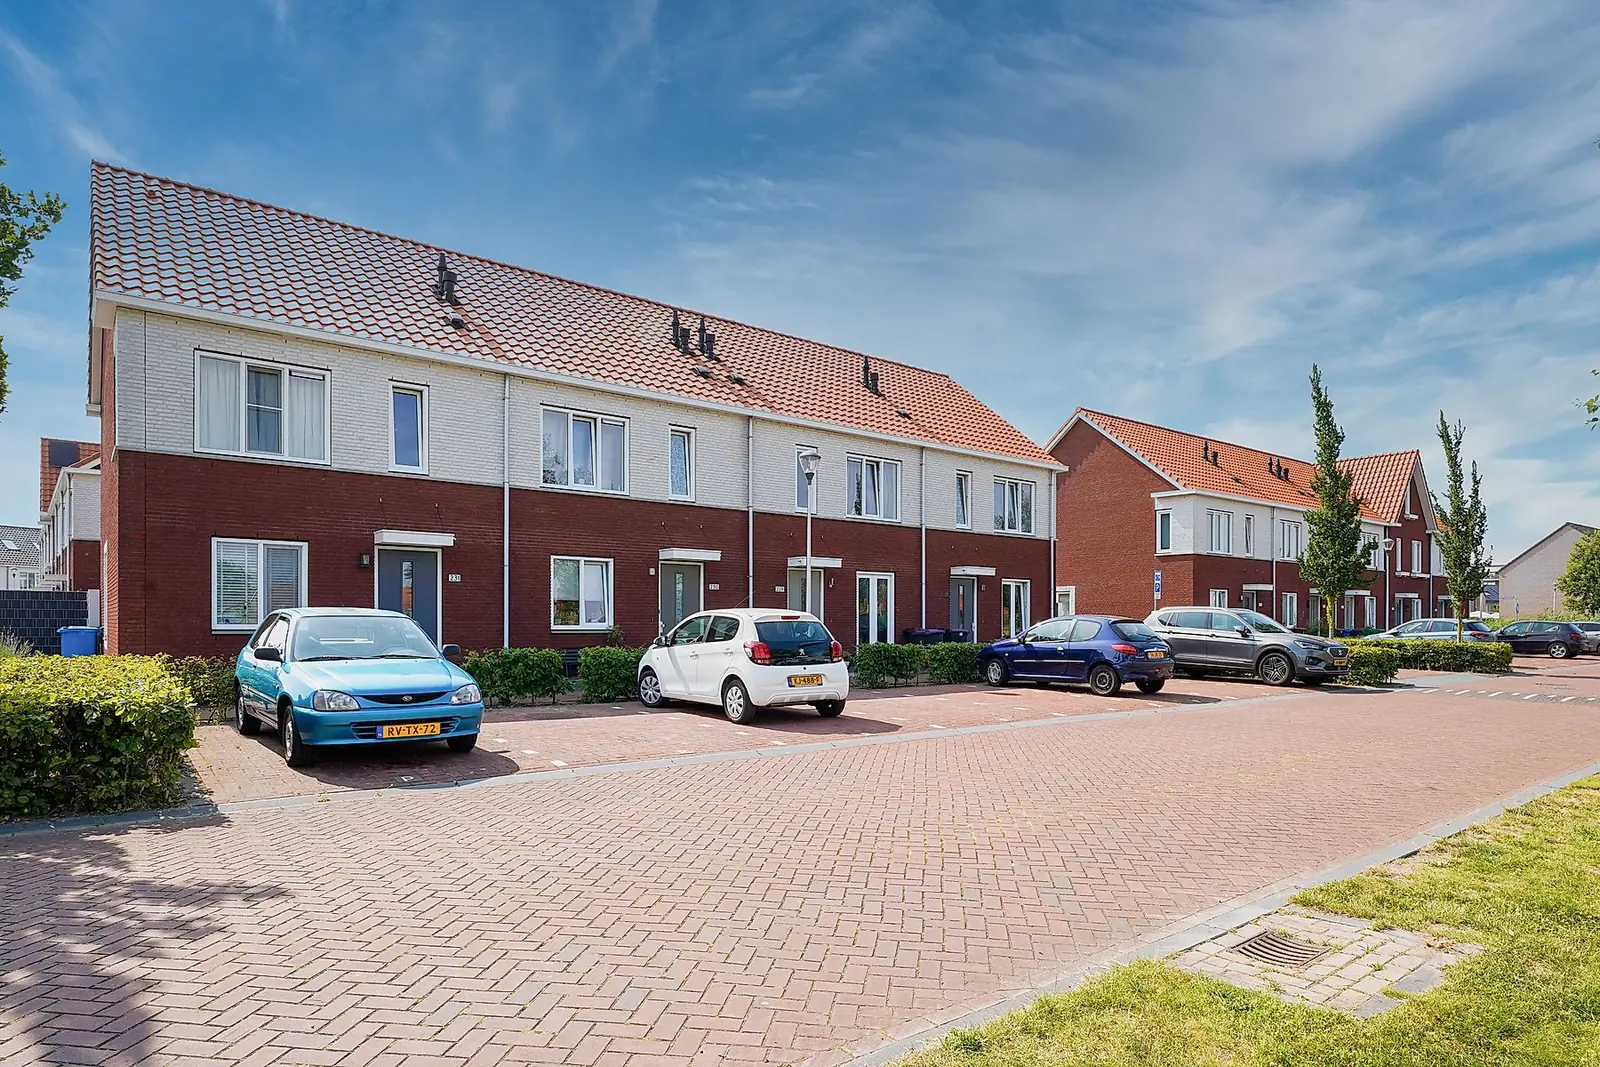
€1,820.00 / month