
Several measures, one question
A report joins related measures, such as asking rent, floor area and price per square meter, so a pattern can be read across them instead of from a single number in isolation.
Choose a structured rental-market report when the question requires several connected measures rather than one isolated indicator. Interpret Rental Market Reports with geography, comparison, and time window attached to the reported value. Match the report's analytical theme to your question, then inspect its included metrics, geography, period, units, aggregation, methodology, and available listing coverage. Compare places only when those definitions and evidence boundaries are compatible.
Every report answers one question with several measures at once. Knowing what a report combines, how far its geography reaches and where its limits sit keeps the conclusions honest.
A report joins related measures, such as asking rent, floor area and price per square meter, so a pattern can be read across them instead of from a single number in isolation.
Netherlands wide reports describe the represented sample as a whole. City reports narrow the same analytical question down to one rental market, including neighbourhood level spreads where the data supports it.
Reports describe advertised listings in a period and sample. They are not official statistics, valuations, forecasts or personal financial advice, and differences between cities reflect coverage as well as market conditions.
These reports read the Dutch rental market as one dataset: how asking rents and price per square meter are distributed, which bedroom counts and property types dominate the advertised supply, what furnishing adds to a rent and how small and large homes are priced against each other.
Use Price Distribution by Location to investigate a local rental-market pattern without treating the analysis as a forecast or recommendation. Use housing mix to frame Price Distribution by location, then inspect method and geography before comparing results.
The rent per m² Distribution by Location analysis brings related measures together while preserving the definitions behind each result. Interpret rent per m² Distribution by location with housing mix, method, and geography attached to the reported value.
Treat Bedroom Mix by Location as a framework for comparing related local measures, not a final judgment about the market or a home. Bedroom Mix by location is most informative when housing mix, method, and geography are read together.
Type Mix Overview by Location combines related rental-market measures around one analytical question rather than presenting a single isolated number. Move from the displayed result on Type Mix Overview by location to housing mix, method, and comparison before interpreting the pattern.
The Furnishing Mix by Location analysis brings related measures together while preserving the definitions behind each result. Move from the displayed result on Furnishing Mix by location to housing mix, method, and geography before interpreting the pattern.
The Small Flat Premium by Location report organizes multiple observations into one coherent question for local comparison. Small Flat Premium by location is most informative when housing mix, method, and comparison are read together.
Open Large Unit Discount by Location for a structured view of the local evidence behind this market theme. Read Large Unit Discount by location as a signal shaped by housing mix, method, and geography, rather than a complete market verdict.
City reports zoom into one rental market and its neighbourhoods, covering price spreads by area, compact and micro unit hotspots, family sized availability, price per square meter clusters, space value bands, rent growth and affordability pressure. Open a report and pick the city you are researching.
The Neighborhood Price Spread by Location analysis brings related measures together while preserving the definitions behind each result. Ground any comparison from Neighborhood Price Spread by location in the same housing mix, method, and geography used by its source.
This Compact Hotspots by Location view helps renters and researchers examine how several market signals interact in the selected location. Before drawing a conclusion from Compact Hotspots by location, verify housing mix, method, and geography in the documented method.
Family Availability by Location offers a broader analytical view than a single metric while keeping the underlying evidence available for scrutiny. Compare Family Availability by location like for like by holding housing mix, method, and geography consistent.
This Rent per m² Hotspots by Location view helps renters and researchers examine how several market signals interact in the selected location. A defensible comparison of Rent per m² Hotspots by location keeps housing mix aligned with method and geography.
Type Bedroom Matrix by Location combines related rental-market measures around one analytical question rather than presenting a single isolated number. Compare Type Bedroom Matrix by location like for like by holding housing mix, method, and comparison consistent.
Treat Space Value Bands by Location as a framework for comparing related local measures, not a final judgment about the market or a home. Before drawing a conclusion from Space Value Bands by location, verify housing mix, method, and comparison in the documented method.
Open Rent Growth Heatmap by Location for a structured view of the local evidence behind this market theme. Treat Rent Growth Heatmap by location as market evidence only where housing mix, method, and comparison remain compatible.
Use the evidence in Affordability Pressure Index by Location to identify what deserves closer investigation across places, periods, or renter questions. Treat Affordability Pressure Index by location as market evidence only where housing mix, method, and geography remain compatible.
Open Furnishing Premium Tracker by Location for a structured view of the local evidence behind this market theme. Furnishing Premium Tracker by location addresses a defined market question; housing mix, method, and geography set the limits of the answer.
The Micro Unit Stress Monitor by Location report organizes multiple observations into one coherent question for local comparison. For a useful reading of Micro Unit Stress Monitor by location, match housing mix and method before judging geography.
Each covered city has its own neighbourhood price spread, hotspot and availability analyses built from the listings Luntero represents there. Start with the price spread and move through the other reports from the city page.
The covered cities with the lowest advertised rent, set beside the ones where a square metre costs least. Cities that lead the first list often sit mid-table on the second, because a low monthly rent usually reflects a smaller advertised home.
Lowest monthly asking rent among the covered cities
Lowest cost per square metre among the covered cities
Before drawing a conclusion from Rental Market Reports, verify unit, coverage, and sample in the documented method.
Median and average asking rent, price per square meter, time on market, supply volume and the rest of the indicator library.
Browse metricsFind a metric, report or city view by name, unit or topic across everything Luntero publishes about the rental market.
Search market dataMove from represented market data to the apartments, rooms and houses advertised across the Netherlands right now.
Search rentalsHave an idea for a new housing market chart, dataset, or analysis? Submit your request and help shape the next generation of Luntero’s rental market insights. Whether it’s a new metric, city comparison, or visualization, your input helps us expand coverage of Dutch housing trends and create data tools that serve renters, investors, and researchers across the Netherlands.
Explore the latest properties added to Luntero. Find new apartments, houses, and studios across the Netherlands — updated daily to help you discover your next home faster.

€1,125.00 / month
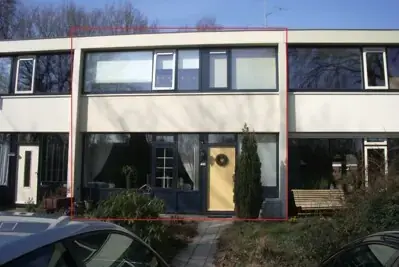
€933.00 / month

€933.00 / month

€849.00 / month
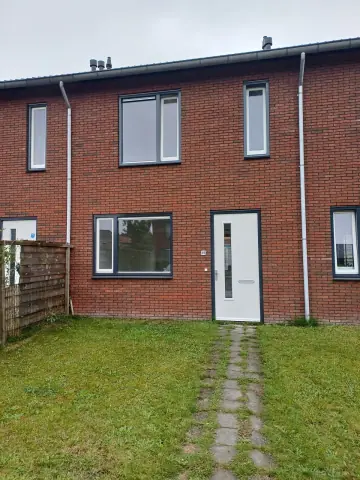
€765.00 / month
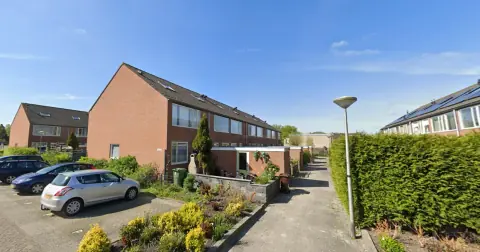
€933.00 / month
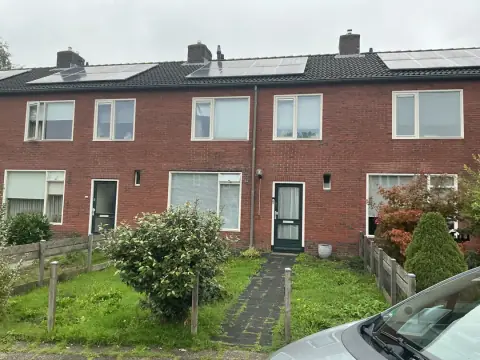
€714.00 / month

€648.00 / month
€714.00 / month
€714.00 / month

€933.00 / month

€649.00 / month