
Dutch city rent rankings
Cheapest and priciest Dutch cities to rent in, compared on rent, rent per m², size, supply and speed.
Compare rent by cityEvery city here has its own rental-market overview: median advertised rent, cost per square metre, movement across three, six and twelve months, new and active listing supply, and a breakdown by bedrooms, property type and furnishing. A city qualifies once enough advertised listings have been collected for it to read reliably, which is why smaller municipalities can be absent. Search for the city you are moving to, or work through the province you are weighing up.
Which Dutch city has the cheapest rent, which the priciest square metre, where homes are largest and where listings go fastest — the current answers before you open any city.
Figures rebuilt October 10, 2026 from advertised listings collected across Dutch rental platforms; every city view and ranking is refreshed daily.
Median advertised rent and rent per square metre for each city, with its national rank and distance from the median, so you can compare Dutch cities before opening one. Filter by city or province, or reorder by rent, rent per m², size or name.
A single average rent tells you almost nothing on its own, because cities differ in what they advertise as much as in what they charge. Every city overview on Luntero pairs the price with the space it buys, the direction it has been moving and the supply behind it.
Median advertised rent shown next to the cost per square metre and the typical advertised floor area, so a cheap headline never passes unexamined.
Advertised rent over three, six and twelve months, each compared with the equally long period before it, so a short-term wobble is distinguishable from a longer drift.
Newly advertised homes over the last thirty days, listings still live, and how long a home typically stays advertised before it disappears.
The split by bedrooms, property type and furnishing, which is usually what explains why two cities with similar asking rents feel nothing alike.
A Dutch city gets a market overview once Luntero has collected enough advertised listings for it to read reliably. Below that threshold a median swings on a handful of homes and would mislead more than it informs, so the city is left out until the sample supports it. Absence says something about the data, not about the place.
A city is published once Luntero holds more than 200 represented advertised listings for it; 79 Dutch cities currently clear that bar.
Every figure describes advertised asking rents in listings Luntero collects from Dutch rental platforms, not signed contracts, social housing allocations or the complete local housing stock.
What the median rent, rent per square metre and size figures on each city overview mean, where they come from, and why a city can look cheap on one measure and expensive on another.
If you are still choosing between places rather than reading up on one, the national comparison lines the covered Dutch cities up on advertised rent, cost per square metre, typical rental size and listing supply.
Cheapest and priciest Dutch cities to rent in, compared on rent, rent per m², size, supply and speed.
Compare rent by cityMedian and average asking rent, price per square meter, time on market, supply volume and the rest of the indicator library.
Browse metricsMulti measure analyses of pricing, supply, composition, space, affordability and market speed across the Netherlands and its cities.
Browse reportsHave an idea for a new housing market chart, dataset, or analysis? Submit your request and help shape the next generation of Luntero’s rental market insights. Whether it’s a new metric, city comparison, or visualization, your input helps us expand coverage of Dutch housing trends and create data tools that serve renters, investors, and researchers across the Netherlands.
Explore the latest properties added to Luntero. Find new apartments, houses, and studios across the Netherlands — updated daily to help you discover your next home faster.
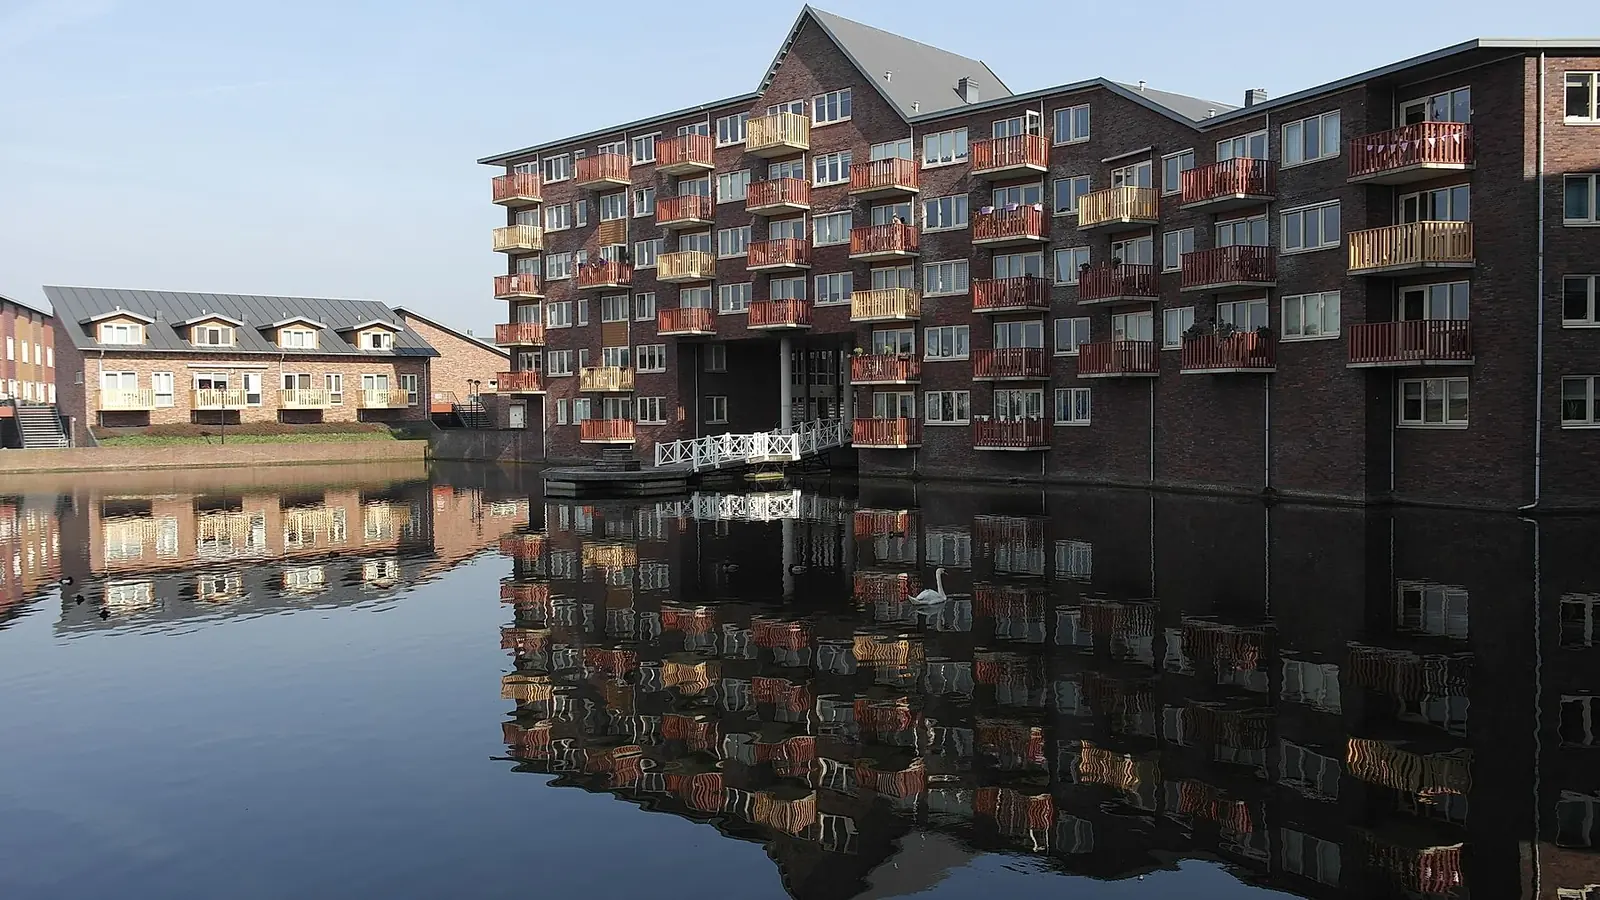
€1,192.00 / month
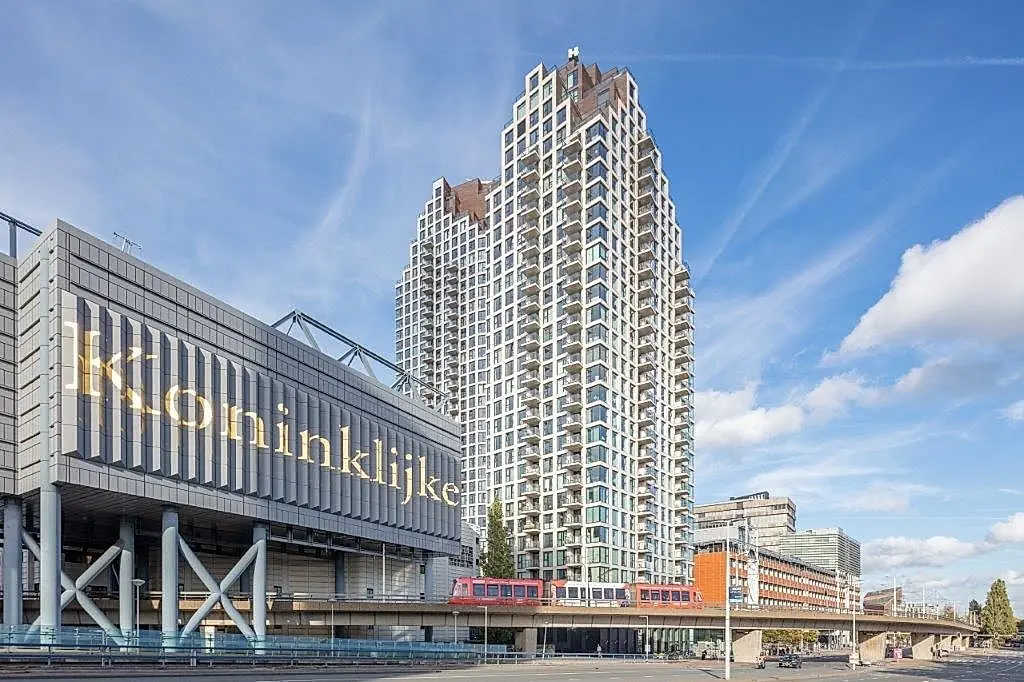
€1,552.00 / month
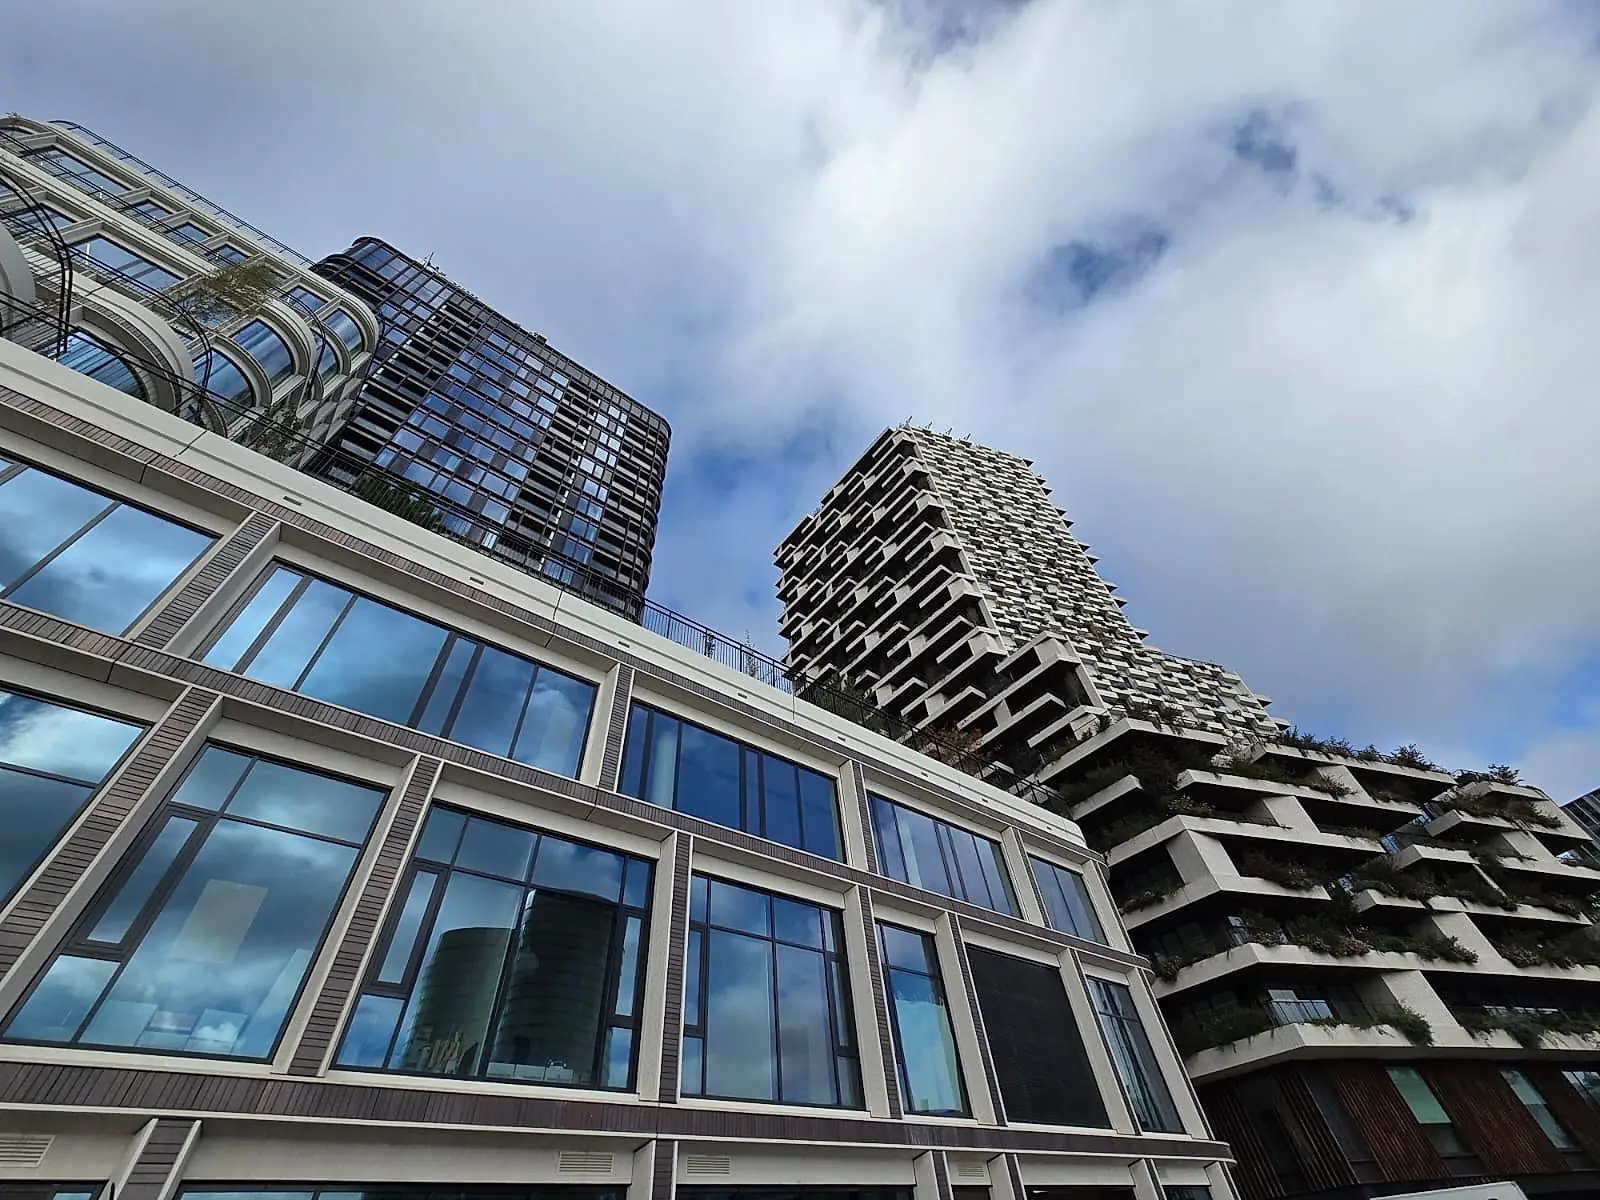
€1,612.00 / month
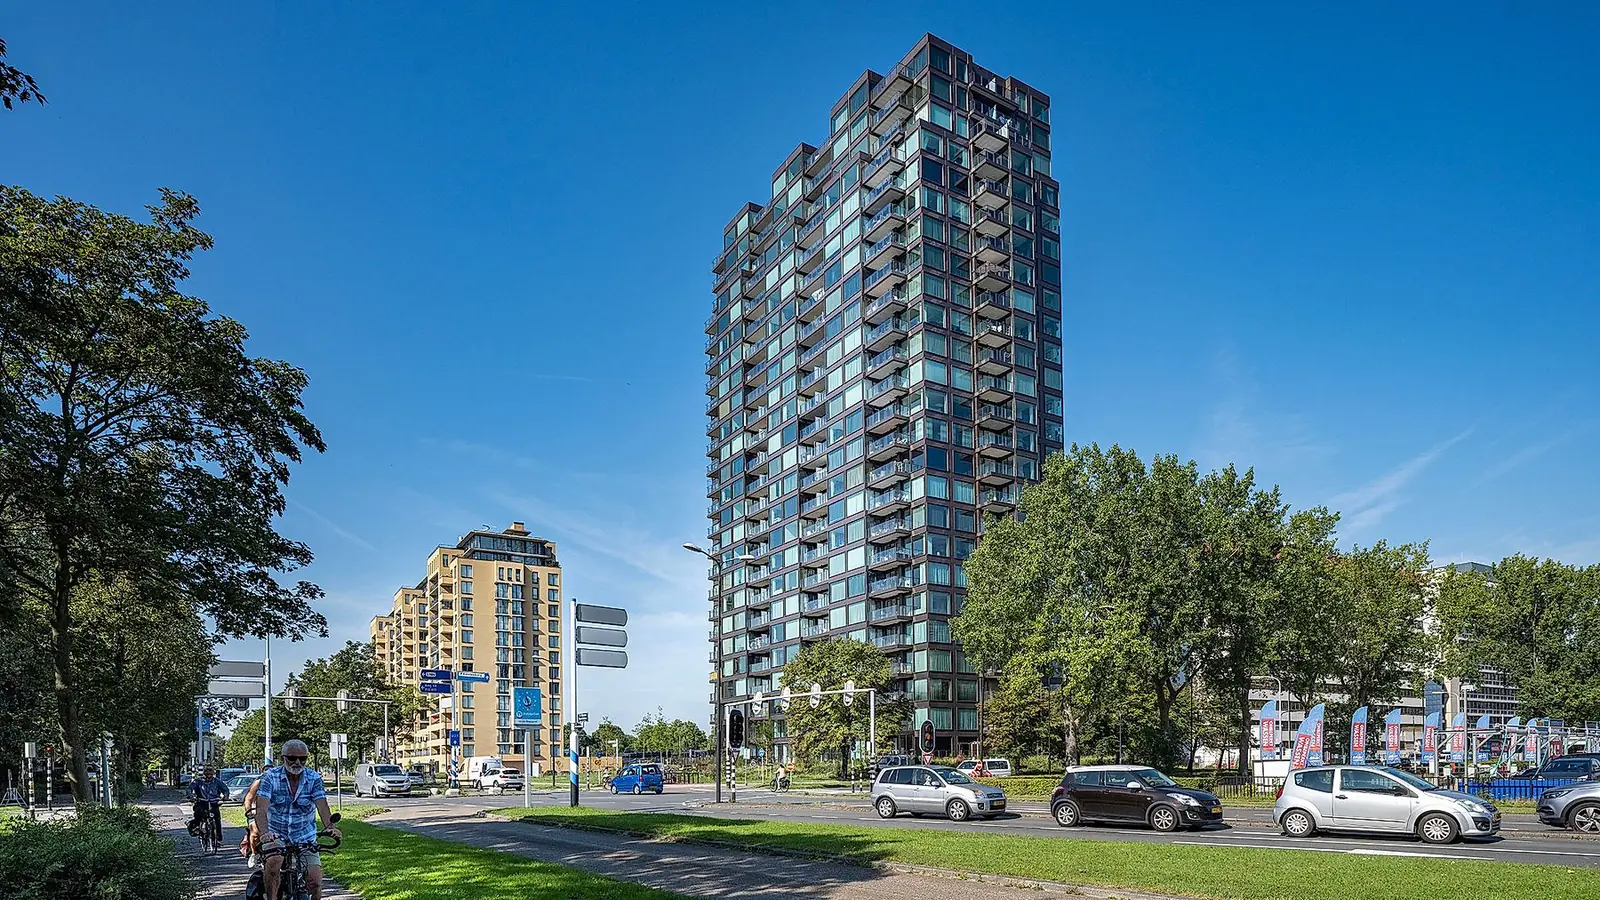
€1,601.00 / month
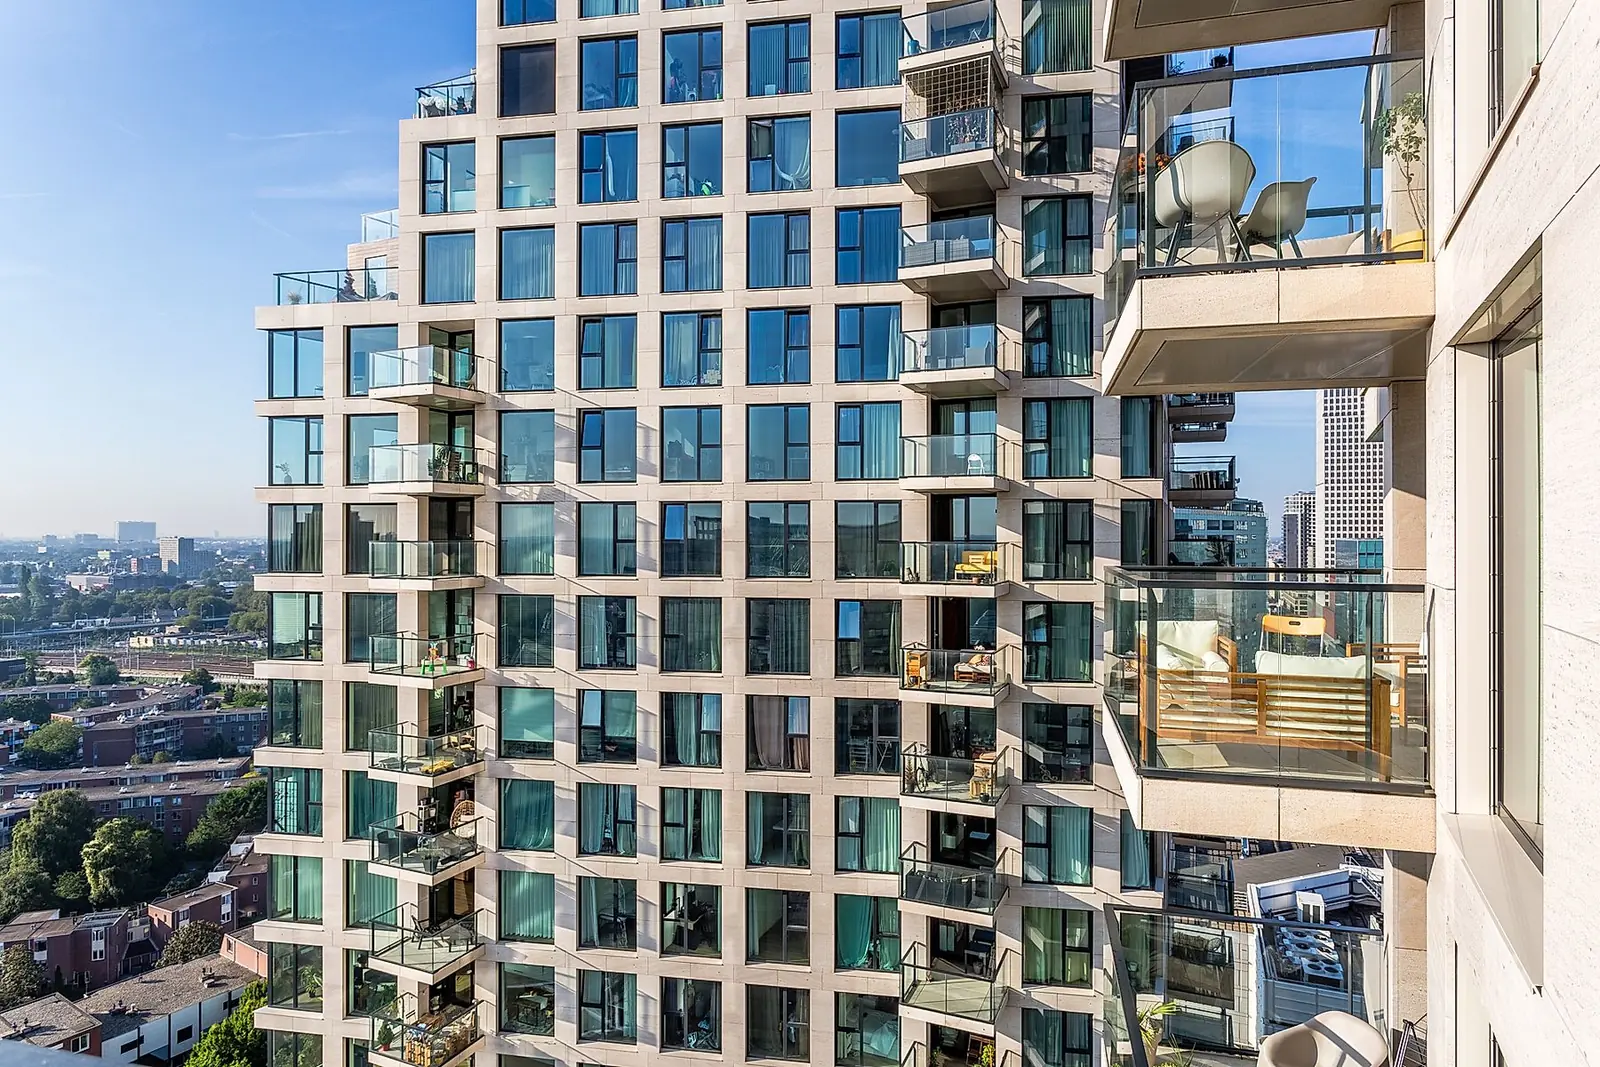
€1,186.00 / month
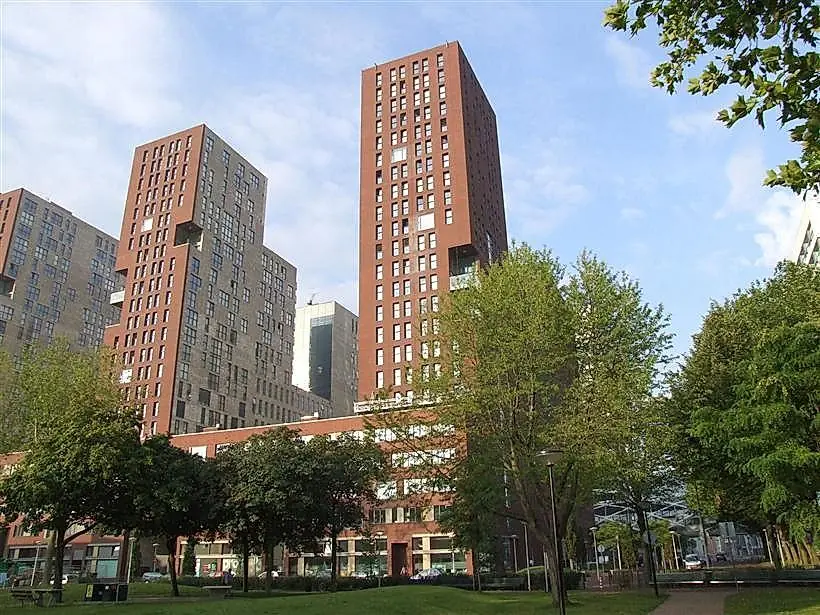
€1,993.00 / month
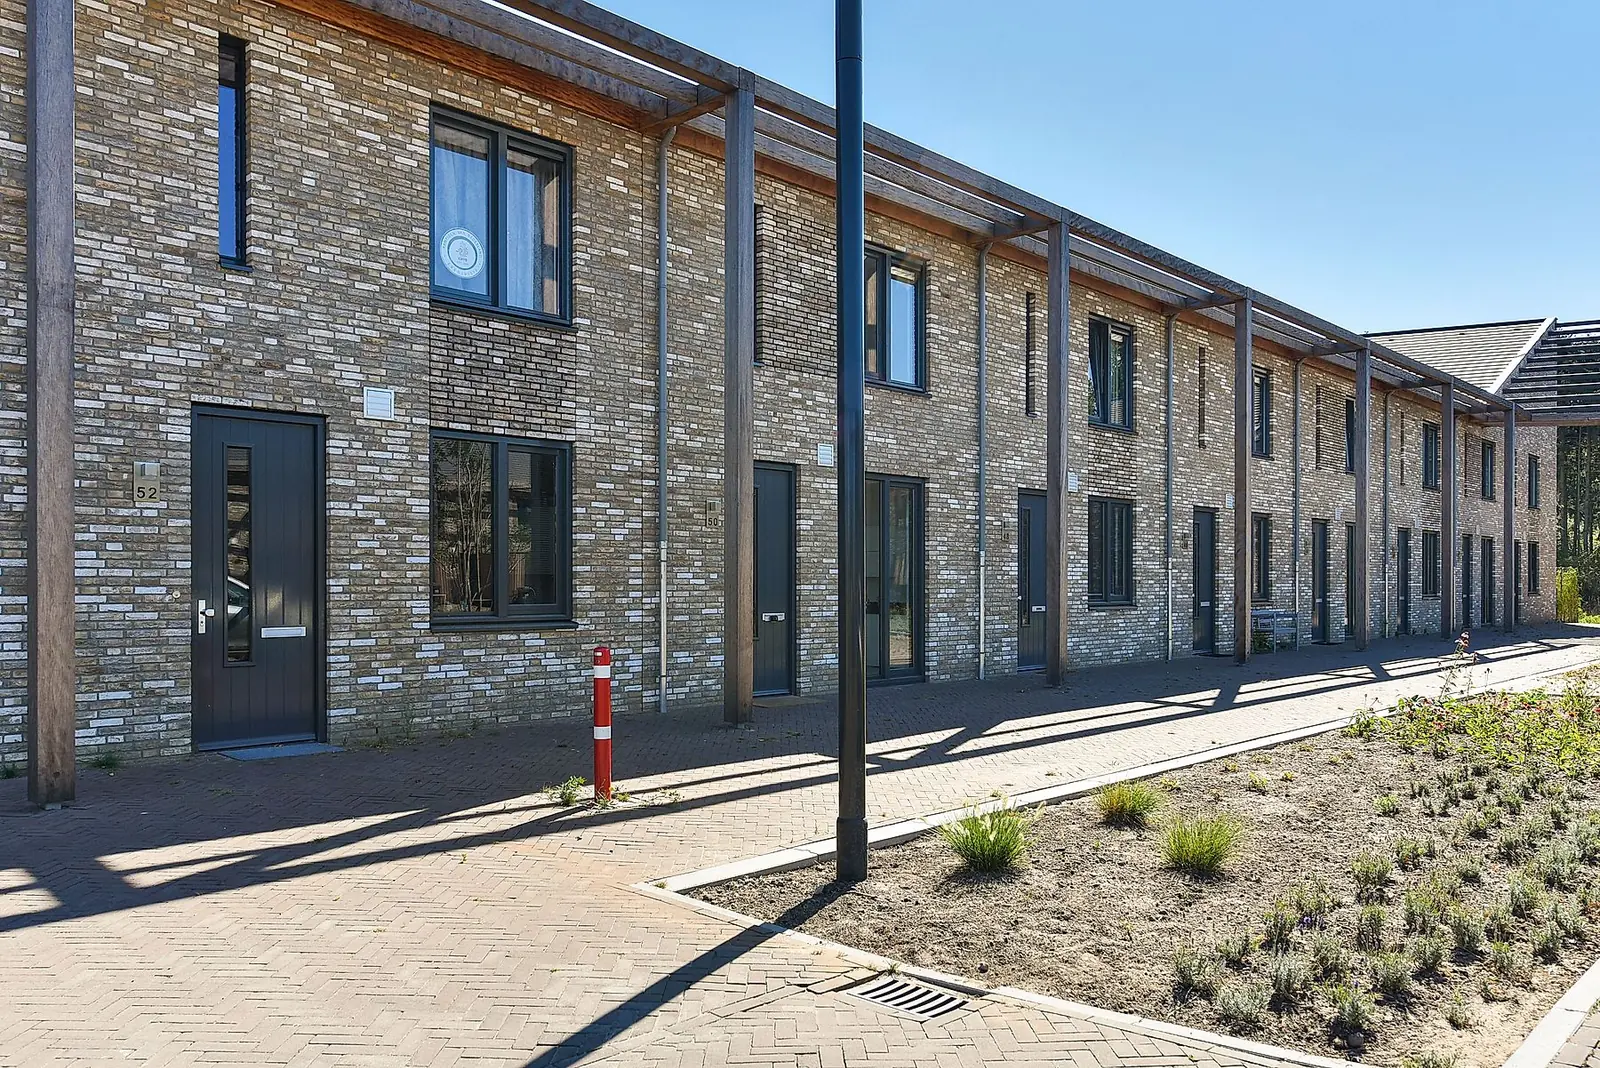
€1,455.00 / month
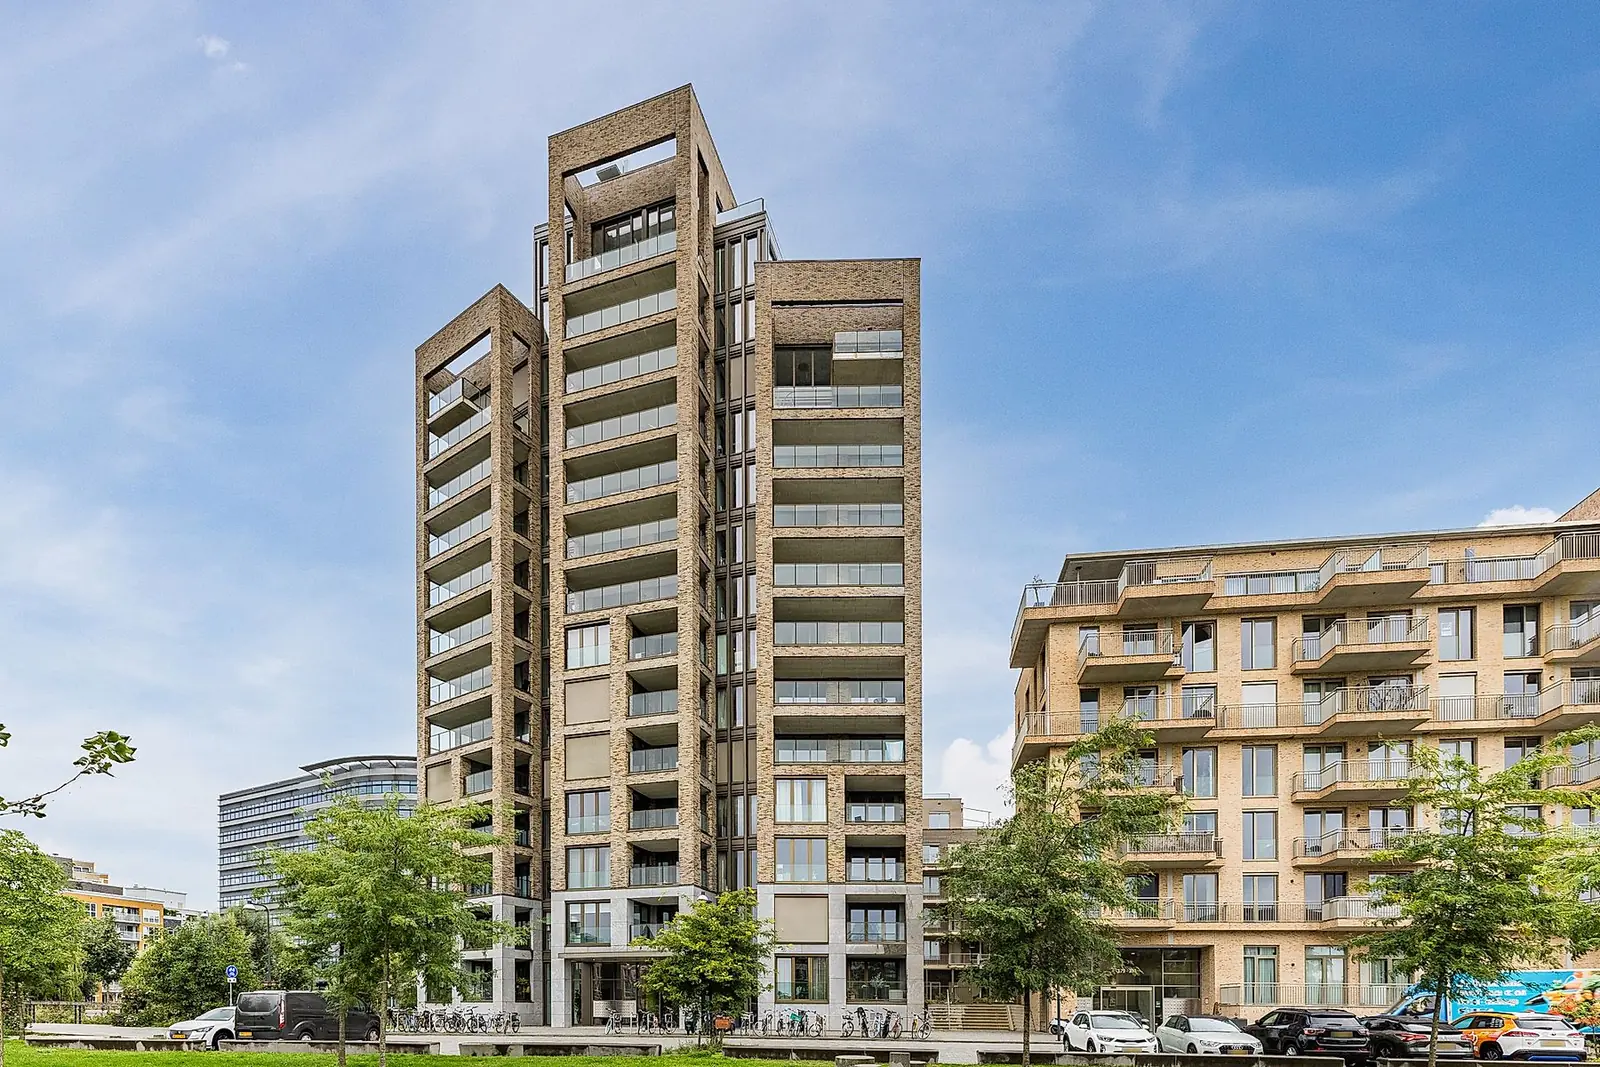
€2,111.00 / month
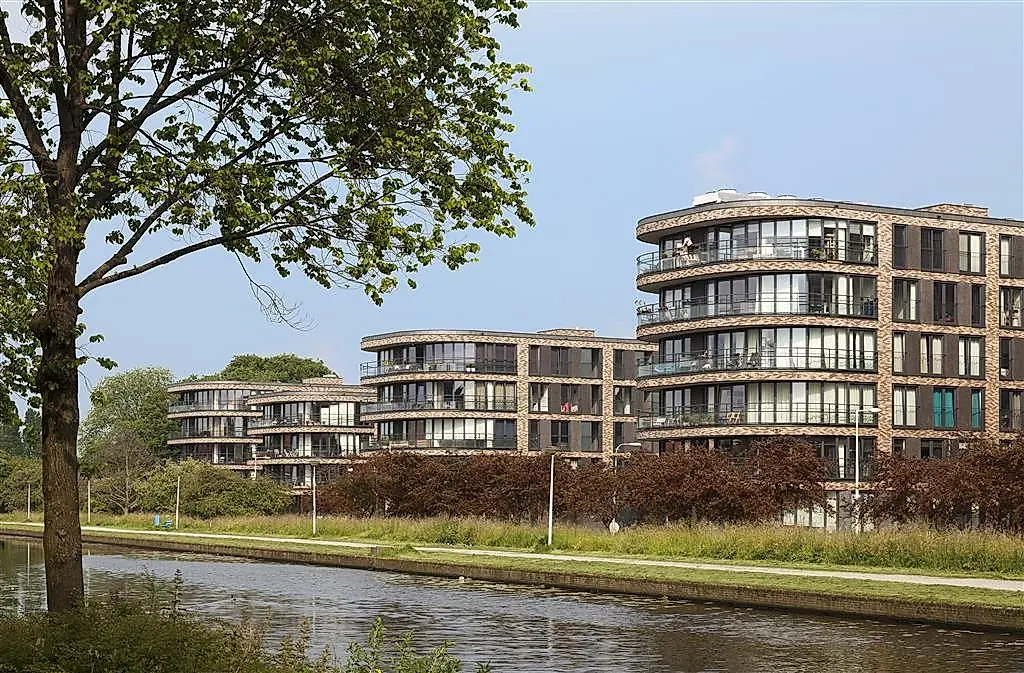
€2,129.00 / month
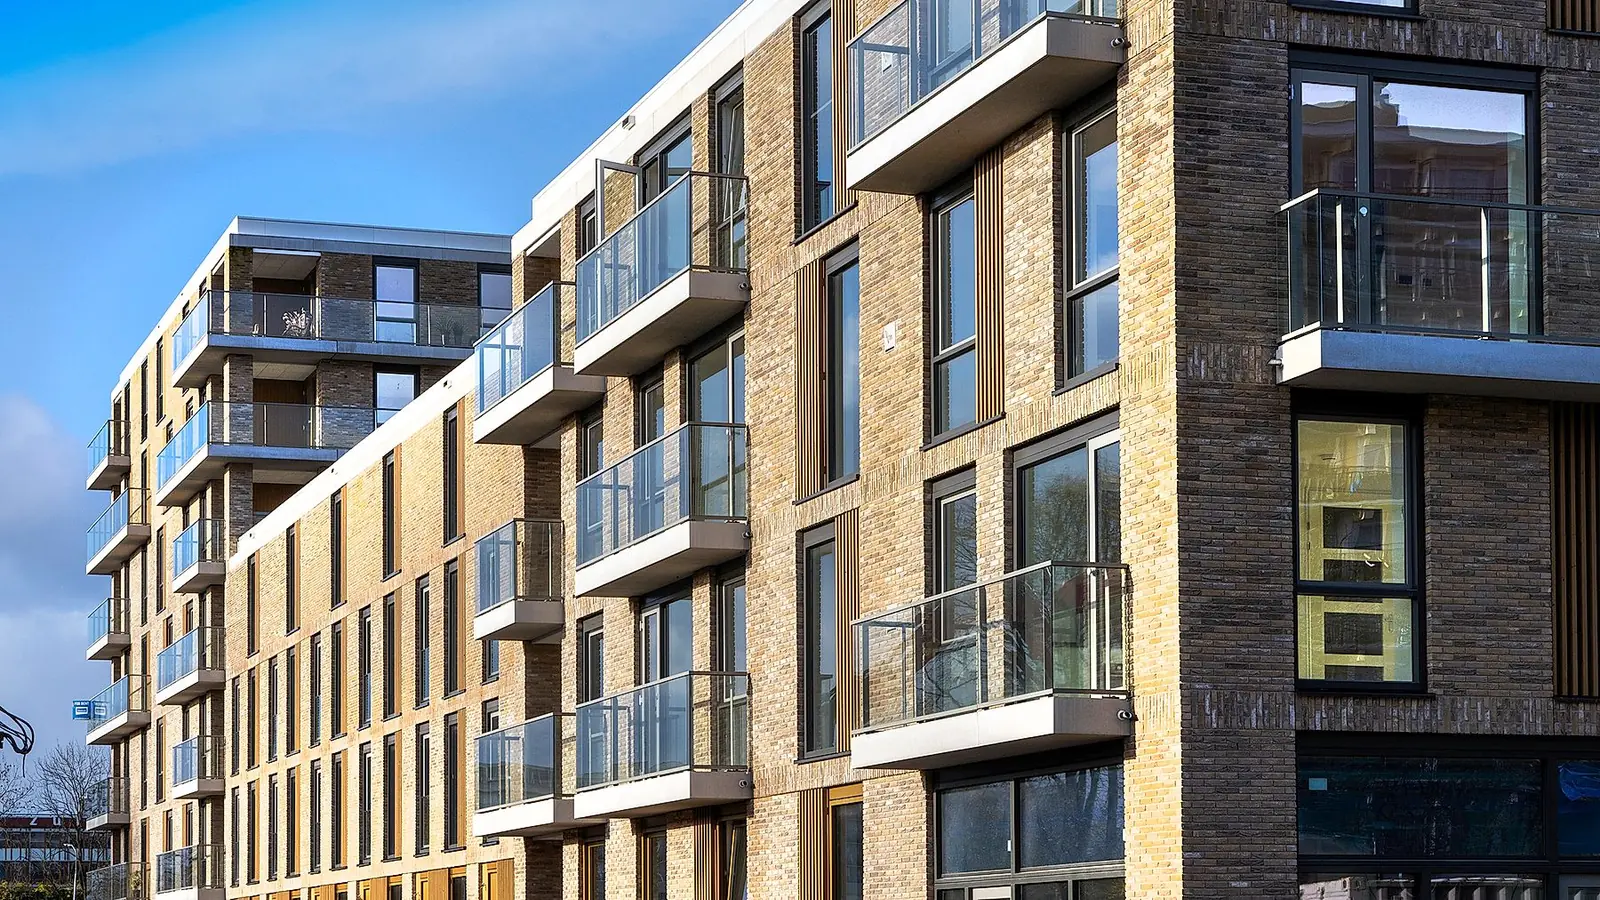
€1,549.00 / month
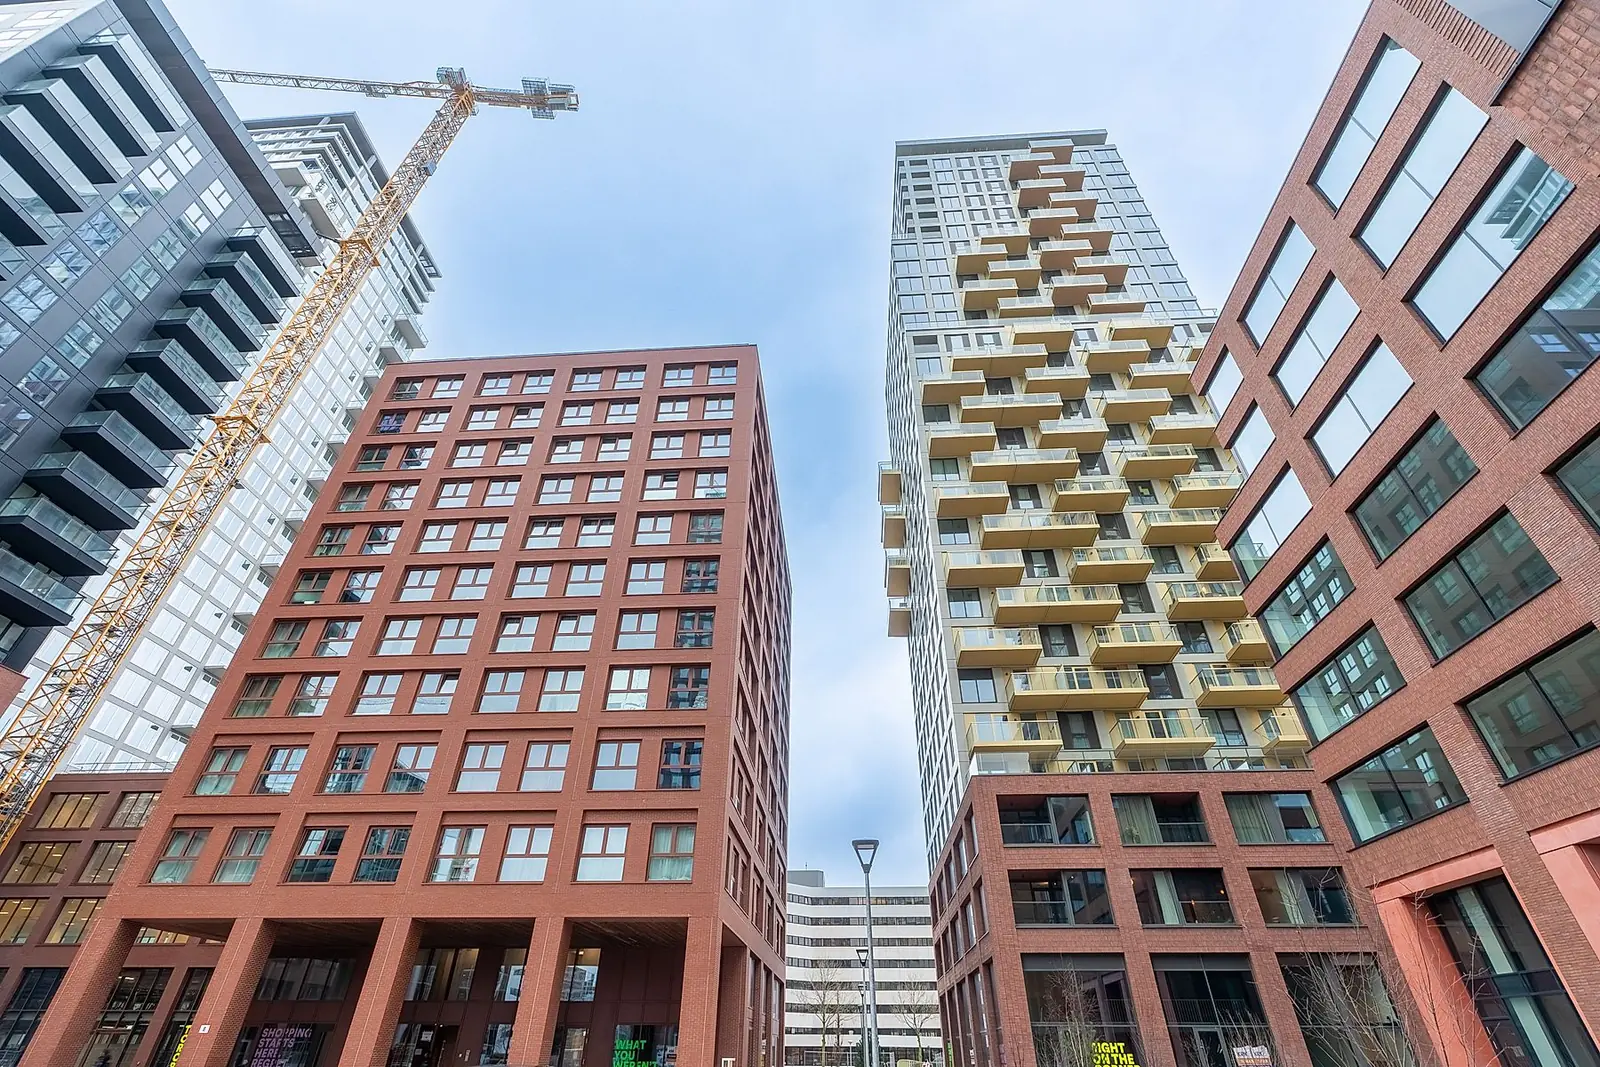
€1,303.00 / month
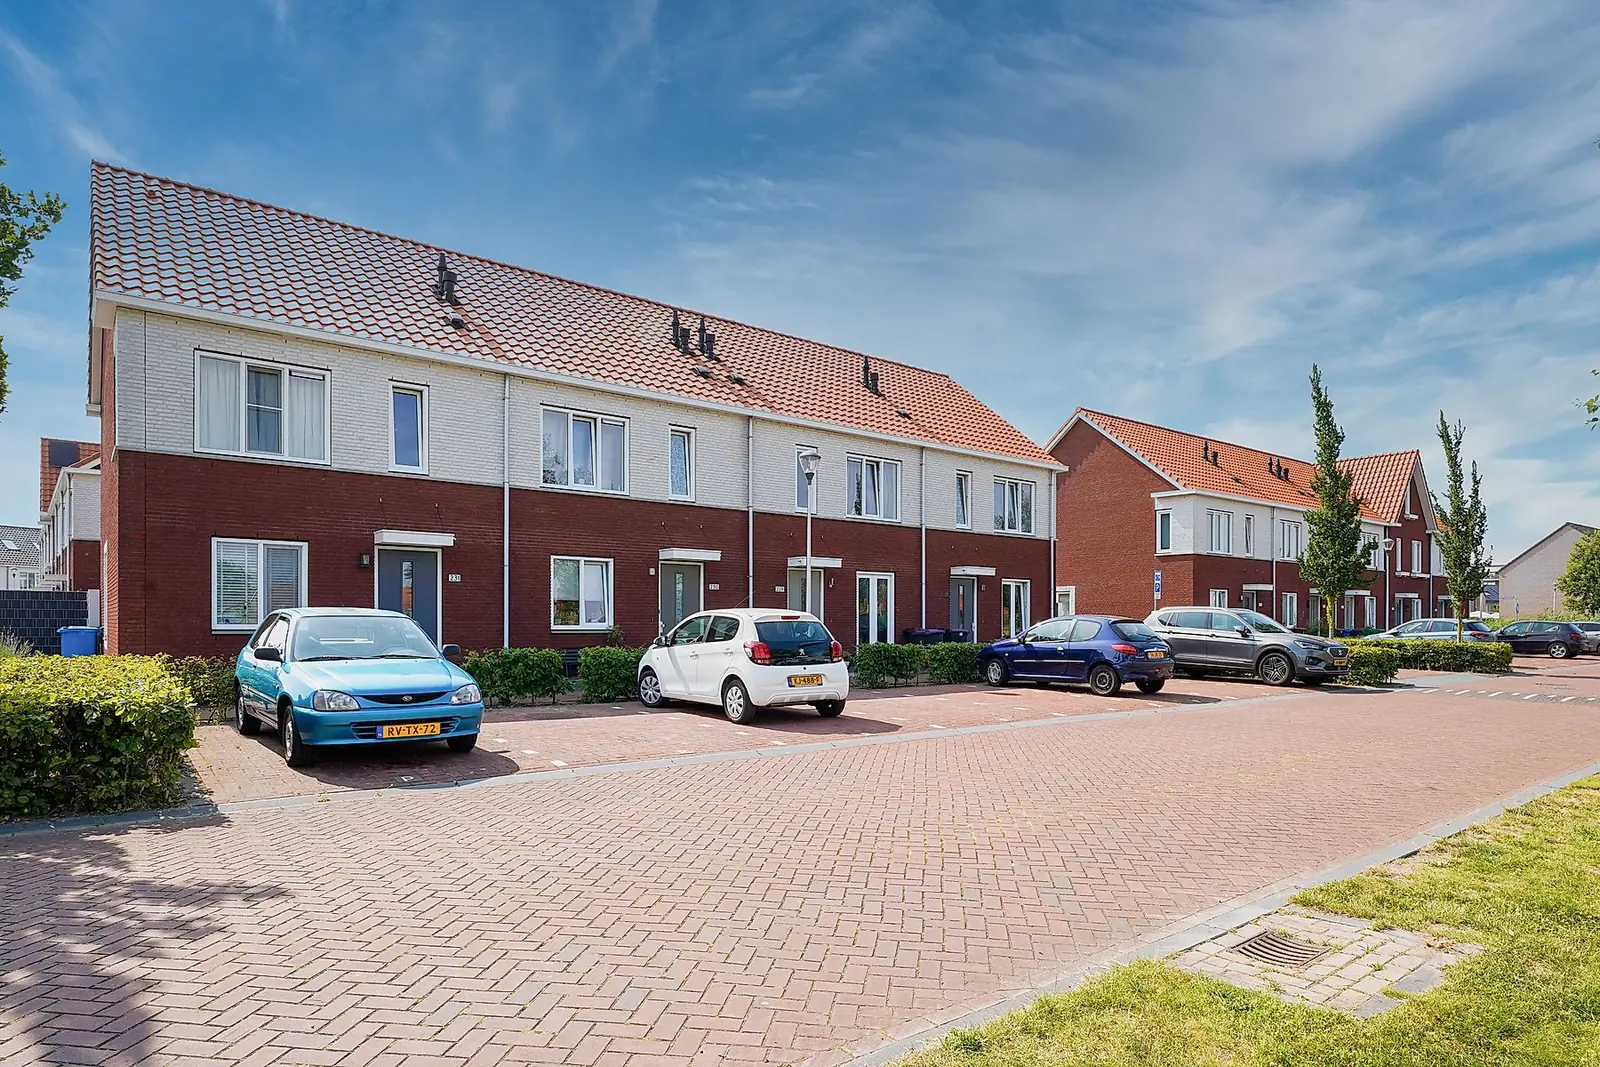
€1,820.00 / month