
Air Quality by City: Observation Time, Station Setting, and Data Recency
Read Air Quality by City with station, recency, and source attached to the reported observation.
Air Quality by City: select an available Dutch city to discover relevant monitoring stations and connect their observations with component explanations and map context. Read Air Quality by City with reporting interval, pollutant, and unit attached to the observation. Open the city you are researching, identify its included stations, and inspect the exact component, unit, timestamp, and source behind each observation.
Air Quality Rankings: Cleanest and Most Polluted Dutch Cities
Compare Dutch cities based on average nitrogen dioxide (NO₂) levels in the past month measured by Luchtmeetnet. Cities with lower NO₂ values generally have cleaner air and healthier living conditions, while higher levels often indicate heavier traffic or industrial influence.
Dutch Cities Monitored
Explore air quality data for cities across the Netherlands. Each page includes recent measurements, pollutant breakdowns, and nearby monitoring stations so you can better understand local conditions.
Amsterdam
11 stations
Rotterdam
8 stations
Moerdijk
5 stations
Haarlemmermeer
5 stations
Velsen
5 stations
The Hague
4 stations
Zaanstad
3 stations
Arnhem
2 stations
Nijmegen
2 stations
Schouwen-Duiveland
2 stations
Sittard-Geleen
2 stations
Woensdrecht
2 stations
Groningen
2 stations
Ridderkerk
2 stations
Terneuzen
2 stations
Eindhoven
2 stations
Maastricht
2 stations
Breda
2 stations
Heerlen
2 stations
Hellendoorn
1 station
Dordrecht
1 station
Beverwijk
1 station
Eijsden-Margraten
1 station
Beekdaelen
1 station
Noardeast-Fryslân
1 station
Ede
1 station
Hilvarenbeek
1 station
Enschede
1 station
Berkelland
1 station
Lopik
1 station
Bernheze
1 station
Steenwijkerland
1 station
Alkmaar
1 station
Hollands Kroon
1 station
Woerden
1 station
Vlaardingen
1 station
Noordwijk
1 station
Almere
1 station
Roerdalen
1 station
Maassluis
1 station
Venray
1 station
Borger-Odoorn
1 station
Veldhoven
1 station
Nederweert
1 station
Schiedam
1 station
Dronten
1 station
Stichtse Vecht
1 station
Hoeksche Waard
1 station
The Pollutants Being Measured
What NO₂, ozone and fine dust actually are, where they come from, and at what concentration each one moves from good to bad on the official Dutch scale.
LKI
The Dutch Air Quality Index (LKI) gives a simple snapshot of overall air pollution levels. It combines key pollutants into one score to help you quickly understand today’s air quality.
Nitrogen dioxide
Nitrogen dioxide (NO₂) is a traffic-related gas that often spikes in busy urban areas. It’s a major contributor to smog and can affect both lungs and overall health.
Particulate matter
PM10 particles are coarse dust and soot small enough to be inhaled into the upper airways. They often come from traffic, construction, and natural sources like dust storms.
Fine particles
PM2.5 particles are fine pollutants that penetrate deep into the lungs and bloodstream. They are among the most harmful pollutants, mainly from combustion and chemical reactions in the air.
Ozone
Ground-level ozone (O₃) is a secondary pollutant formed on sunny days from traffic and industrial gases. It irritates the lungs and damages plants, making it a key driver of summer smog.
Dutch and EU Air Quality Context
All air quality information on Luntero comes from Luchtmeetnet, the official Dutch air monitoring network operated under national and EU standards. This ensures that every measurement—whether for NO₂, PM, O₃, or the LKI index—is consistent, transparent, and comparable across the Netherlands and other European countries.
Newest Properties in the Netherlands
Explore the latest properties added to Luntero. Find new apartments, houses, and studios across the Netherlands — updated daily to help you discover your next home faster.
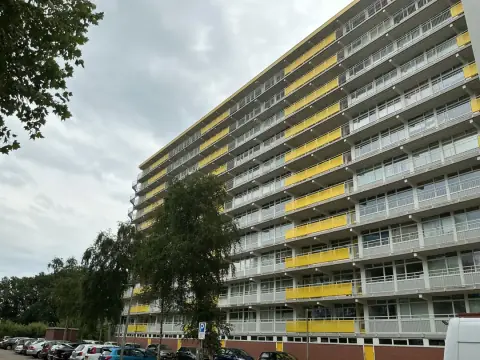
€714.00 / month

€984.00 / month

€937.00 / month

€1,350.00 / month

€1,675.00 / month
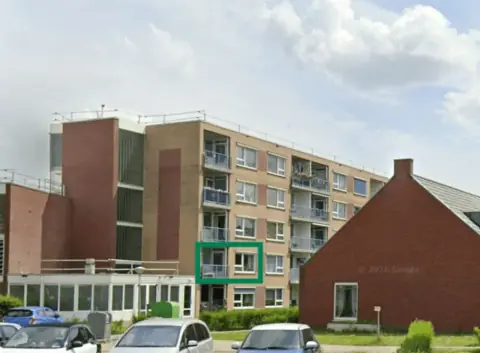
€735.00 / month

€2,500.00 / month
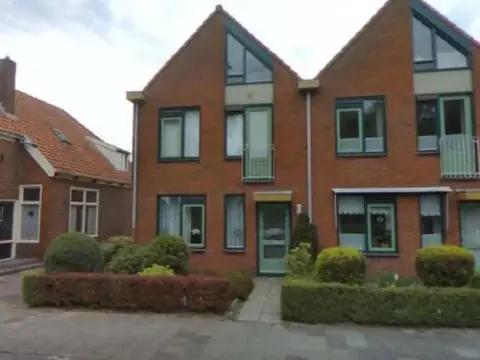
€714.00 / month
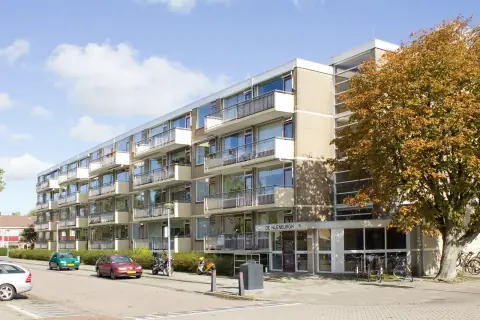
€662.00 / month
€988.00 / month
€606.00 / month
€650.00 / month