
Homes for rent in Rijswijk
The rental listings currently advertised in Rijswijk, with the market figures above as your reference point.
Homes for rent in RijswijkRijswijk occupies the narrow strip between The Hague and Delft, which puts two very different markets within a few minutes in either direction. A long programme of converting redundant office buildings into apartments has added a distinctive layer of purpose-built rental supply, weighted towards smaller units and often furnished. That shows up in the bedroom and furnishing composition, and it is why the cost per square metre belongs next to the median advertised rent here.
Median advertised rent for Rijswijk over the last three months, shown next to the two figures that decide whether it is actually cheap: the cost per square metre, and the typical floor area an asking rent buys here.
Figures rebuilt October 11, 2026 from advertised listings collected across Dutch rental platforms; every city view and ranking is refreshed daily.
Where Rijswijk ranks on monthly rent and on rent per square metre among the 48 Dutch cities Luntero covers, with every other city on the same axis. A cheap-looking city often moves once rent is divided by floor area.
Plain answers from the current numbers: where Rijswijk ranks on rent and on cost per square metre, what a typical home there measures, and how quickly listings go.
Each window holds the median advertised rent for that period next to the equally long period before it. Reading all three together separates a short-term swing from a longer drift, which one window on its own can never do.
Windows overlap by design: the twelve-month figure includes the three-month one, so a fast recent move shows up sharply in the short window and softly in the long one. A shift also reflects what is being advertised, not only what landlords charge — a period with more rooms or more furnished stock moves the median without any individual rent changing.
How much reaches the Rijswijk market and how long a typical listing stays up, each with the city's rank among covered cities.
Two cities can share an asking rent and offer completely different things for it. This is the breakdown that explains the difference for Rijswijk, across the last twelve months of represented listings.
How the city's advertised supply splits by bedroom count. A market weighted towards studios and one-bedroom homes will always report a lower headline rent than one built around family housing, without being any cheaper per square metre.
The share of apartments, houses, rooms and studios in what landlords and agents advertise. Room-heavy cities are usually student markets, and their medians should never be read as the cost of renting a whole home.
Furnished, upholstered and shell listings ask very different rents for the same floor area. In cities with a large international or relocation segment this split explains more of the headline figure than location does.
Median advertised rent in Rijswijk beside the covered Dutch cities closest to it in market depth, plus the median of all covered cities, so the figure has something to be compared against.
The middle advertised asking rent across listings collected for each city over the last three months. Half of what is advertised sits above it and half below, which makes it far more stable than an average when a handful of luxury or student listings enter the sample.
Every figure describes advertised asking rents in listings Luntero collects from Dutch rental platforms, not signed contracts, social housing allocations or the complete local housing stock.
Stay in Rijswijk and switch the question. The same represented listing sample powers every metric and report below, so you can move from asking rent to price per square meter, supply, space and neighbourhood detail without losing the local context.
Search Rijswijk with the converted-office stock in mind, or compare the municipality against The Hague and Delft to see which neighbour hands back more space.
The rental listings currently advertised in Rijswijk, with the market figures above as your reference point.
Homes for rent in RijswijkMedian and average asking rent, price per square meter, time on market, supply volume and the rest of the indicator library.
Browse metricsCheapest and priciest Dutch cities to rent in, compared on rent, rent per m², size, supply and speed.
Compare with other citiesHave an idea for a new housing market chart, dataset, or analysis? Submit your request and help shape the next generation of Luntero’s rental market insights. Whether it’s a new metric, city comparison, or visualization, your input helps us expand coverage of Dutch housing trends and create data tools that serve renters, investors, and researchers across the Netherlands.
Explore the latest properties added to Luntero. Find new apartments, houses, and studios across the Netherlands — updated daily to help you discover your next home faster.
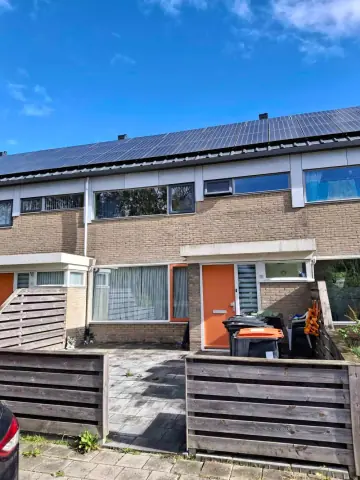
€768.00 / month
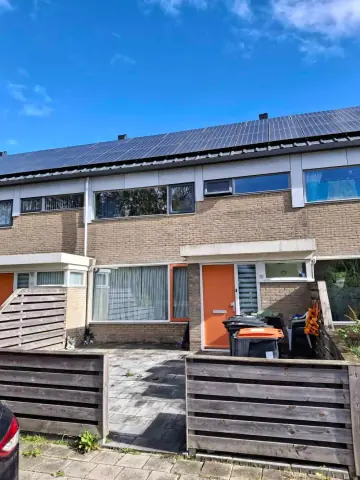
€765.00 / month
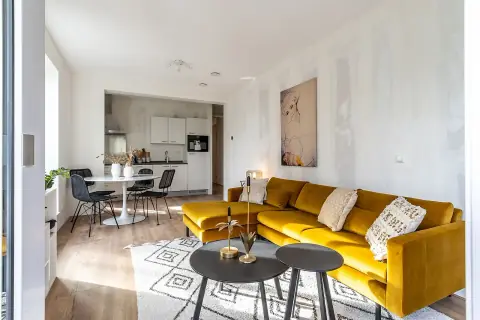
€1,228.00 / month
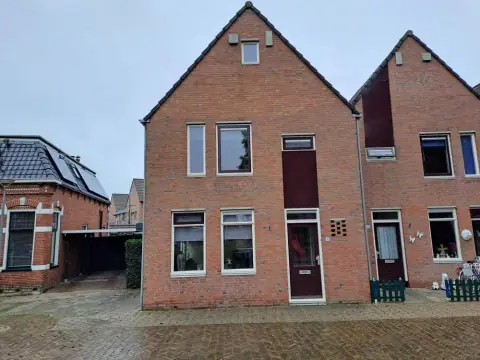
€717.00 / month
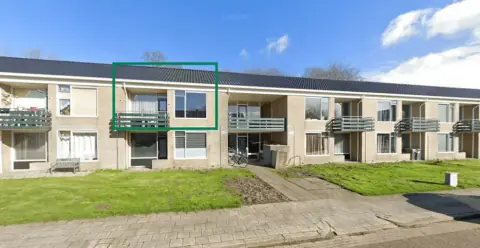
€633.00 / month
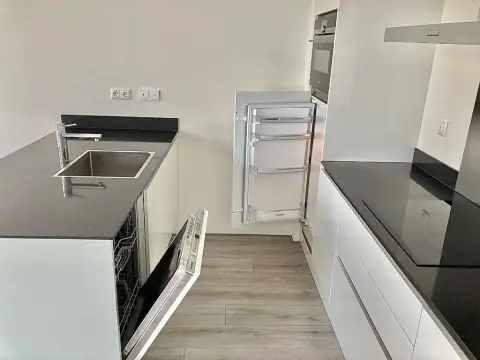
€1,119.00 / month
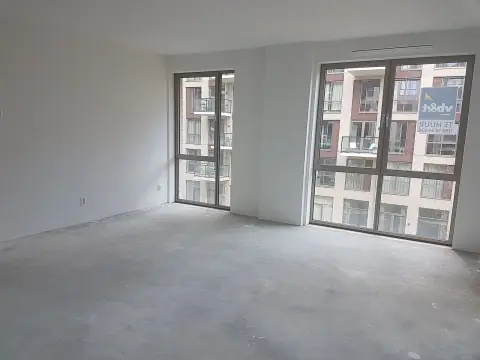
€1,335.00 / month
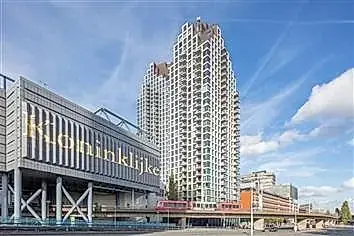
€1,186.00 / month
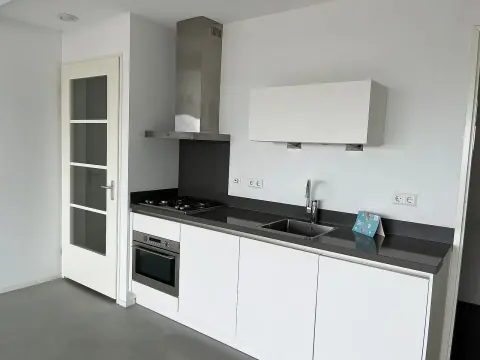
€1,914.00 / month
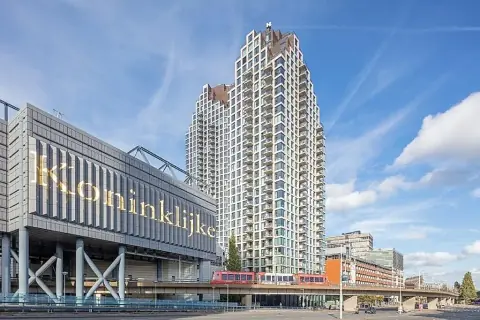
€1,193.00 / month
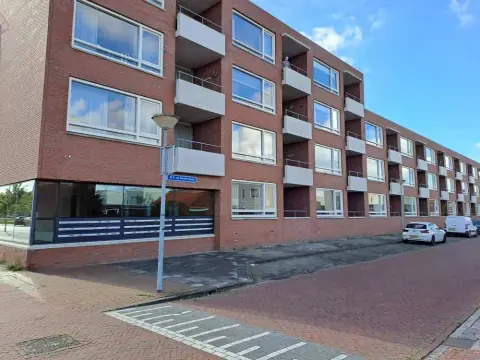
€765.00 / month
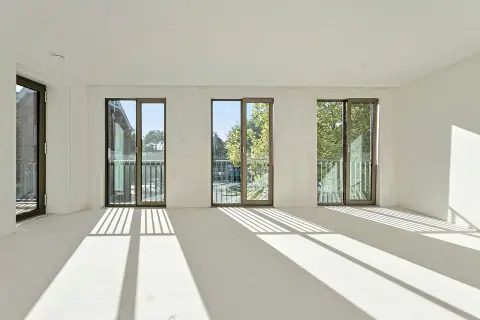
€1,381.00 / month