
Rental market reports
Multi measure analyses of pricing, supply, composition, space, affordability and market speed across the Netherlands and its cities.
Browse reportsRent growth heatmaps show where pricing momentum is strengthening, easing, or turning negative across Venlo’s submarkets. A defensible comparison of Rent Growth Heatmap in Venlo keeps recency aligned with publication date and time window. The value lies in separating broad market movement from local pockets of pressure, so renters and analysts can see whether growth is widespread or concentrated in a few areas.
Compare the relative pace of rent growth across Venlo’s areas to spot where momentum is building and where it is flattening. Focus on the pattern rather than any single point: a few fast-moving submarkets can lift the city average, while stable or cooling areas may signal a more mixed market.
Figures come from the rental listings Luntero represents for the selected period. Sample sizes differ per location and month, so read short movements together with the underlying listing counts rather than as exact market wide changes.
Rent growth heatmaps show where pricing momentum is strengthening, easing, or turning negative across Venlo’s submarkets. The value lies in separating broad market movement from local pockets of pressure, so renters and analysts can see whether growth is widespread or concentrated in a few areas.
The Rent Growth Heatmap — Venlo report organizes multiple observations into one coherent question for local comparison. Rent Growth Heatmap in Venlo is most informative when housing mix, time window, and unit are read together.
A citywide average can hide a narrow set of submarkets driving most of the growth.
Areas that cool after a strong run can matter as much as the fastest-rising pockets.
Consistent growth across many areas suggests broader pricing pressure than a single hotspot.
Flat zones help show where rent inflation is less intense or more evenly absorbed.
Comparing nearby submarkets can reveal whether momentum is spreading or staying localized.
Show how local rent momentum in Venlo differs from the city average.
Explain whether growth is broad-based or concentrated in a few submarkets.
Use the heatmap to identify emerging pressure points and flatter areas.
Compare accelerating areas with places where growth is easing or reversing.
Frame the result as a geography of pricing pressure, not a single headline rate.
This page documents one indicator. The Venlo overview brings the median advertised rent, cost per square metre, three trend windows, listing supply and the bedroom, property-type and furnishing mix together in a single reading.
Stay in Venlo and switch the question. The same represented listing sample powers every metric and report below, so you can move from asking rent to price per square meter, supply, space and neighbourhood detail without losing the local context.
Compare Rent Growth Heatmap by Location across supported Dutch locations using the represented listing sample. Differences reflect the covered sources, period and methodology and are not complete measurements of local supply or demand.
Compare Rent Growth Heatmap in Venlo like for like by holding observation count, coverage, and recency consistent. Move from the Venlo analysis of rent growth heatmap to compatible Dutch locations, keeping the report definition, period, geographic scope, aggregation, and coverage consistent.
Multi measure analyses of pricing, supply, composition, space, affordability and market speed across the Netherlands and its cities.
Browse reportsMedian and average asking rent, price per square meter, time on market, supply volume and the rest of the indicator library.
Browse metricsSee the apartments, rooms and houses currently advertised in Venlo and filter them by price, size and property type.
Search Venlo rentalsHave an idea for a new housing market chart, dataset, or analysis? Submit your request and help shape the next generation of Luntero’s rental market insights. Whether it’s a new metric, city comparison, or visualization, your input helps us expand coverage of Dutch housing trends and create data tools that serve renters, investors, and researchers across the Netherlands.
Explore the latest properties added to Luntero. Find new apartments, houses, and studios across the Netherlands — updated daily to help you discover your next home faster.
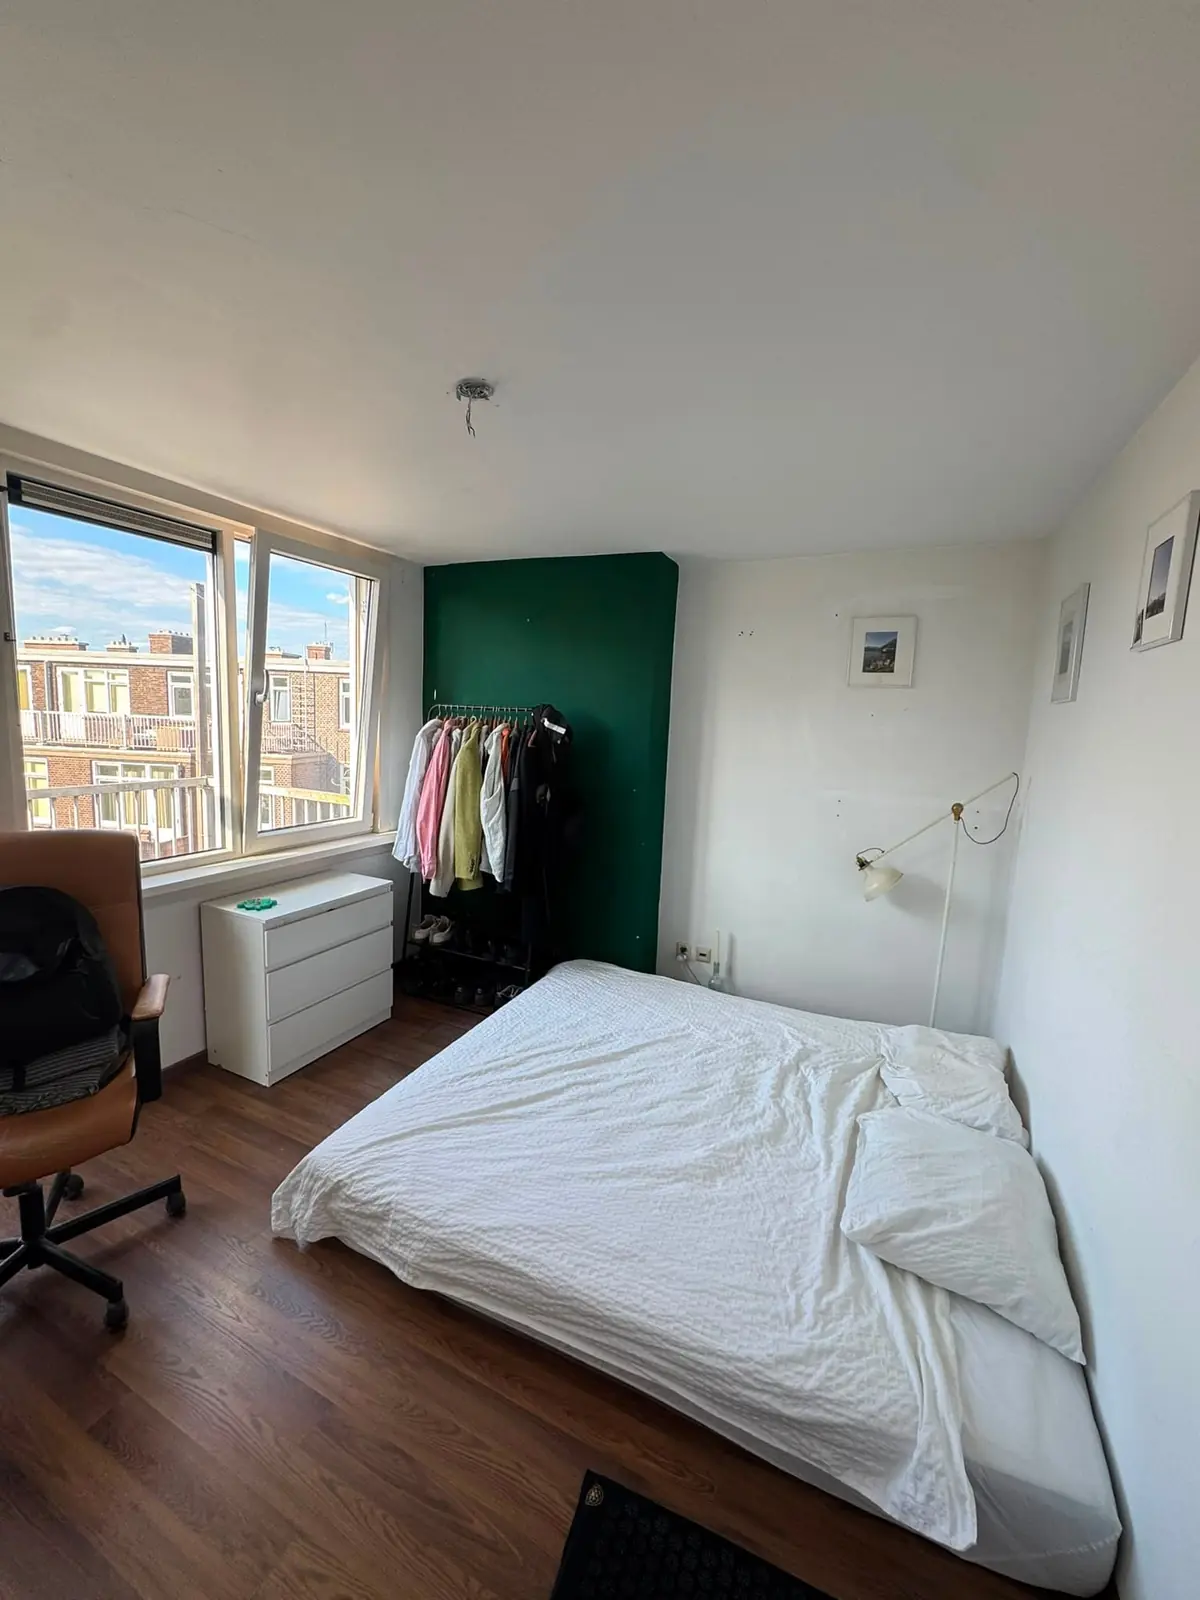
€690.00 / month
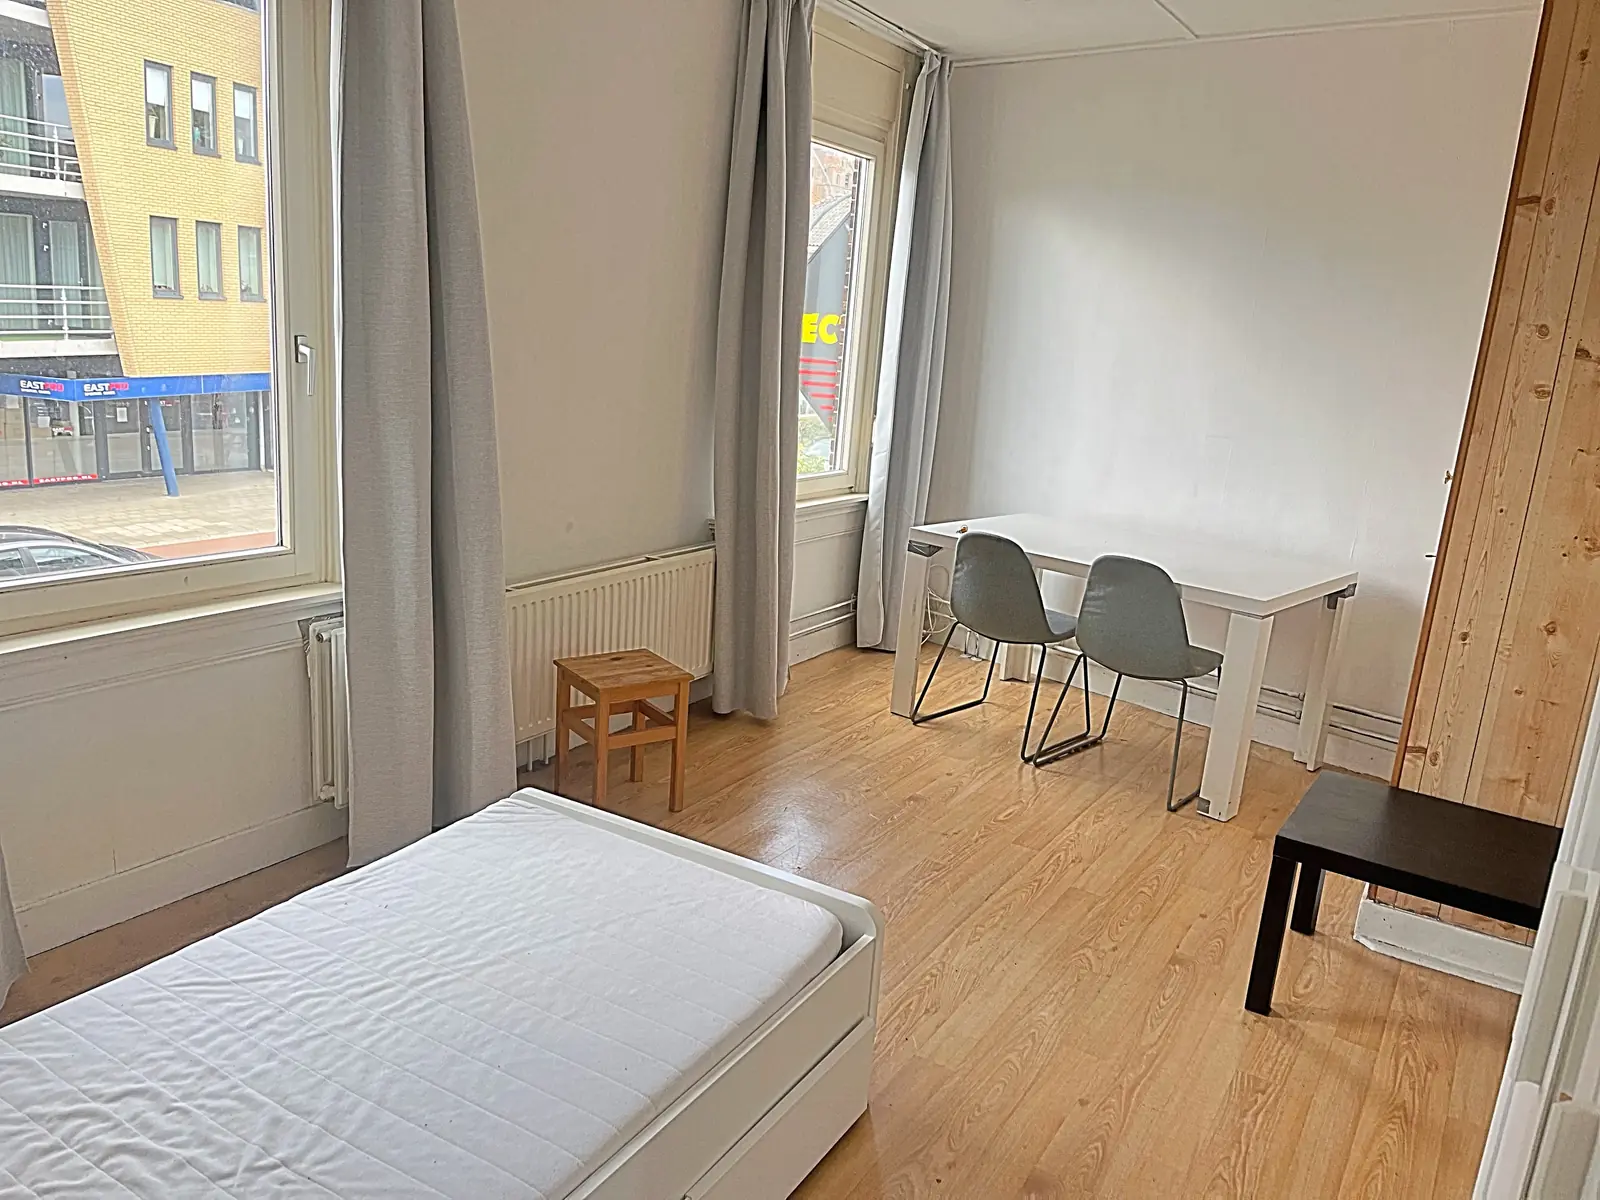
€695.00 / month
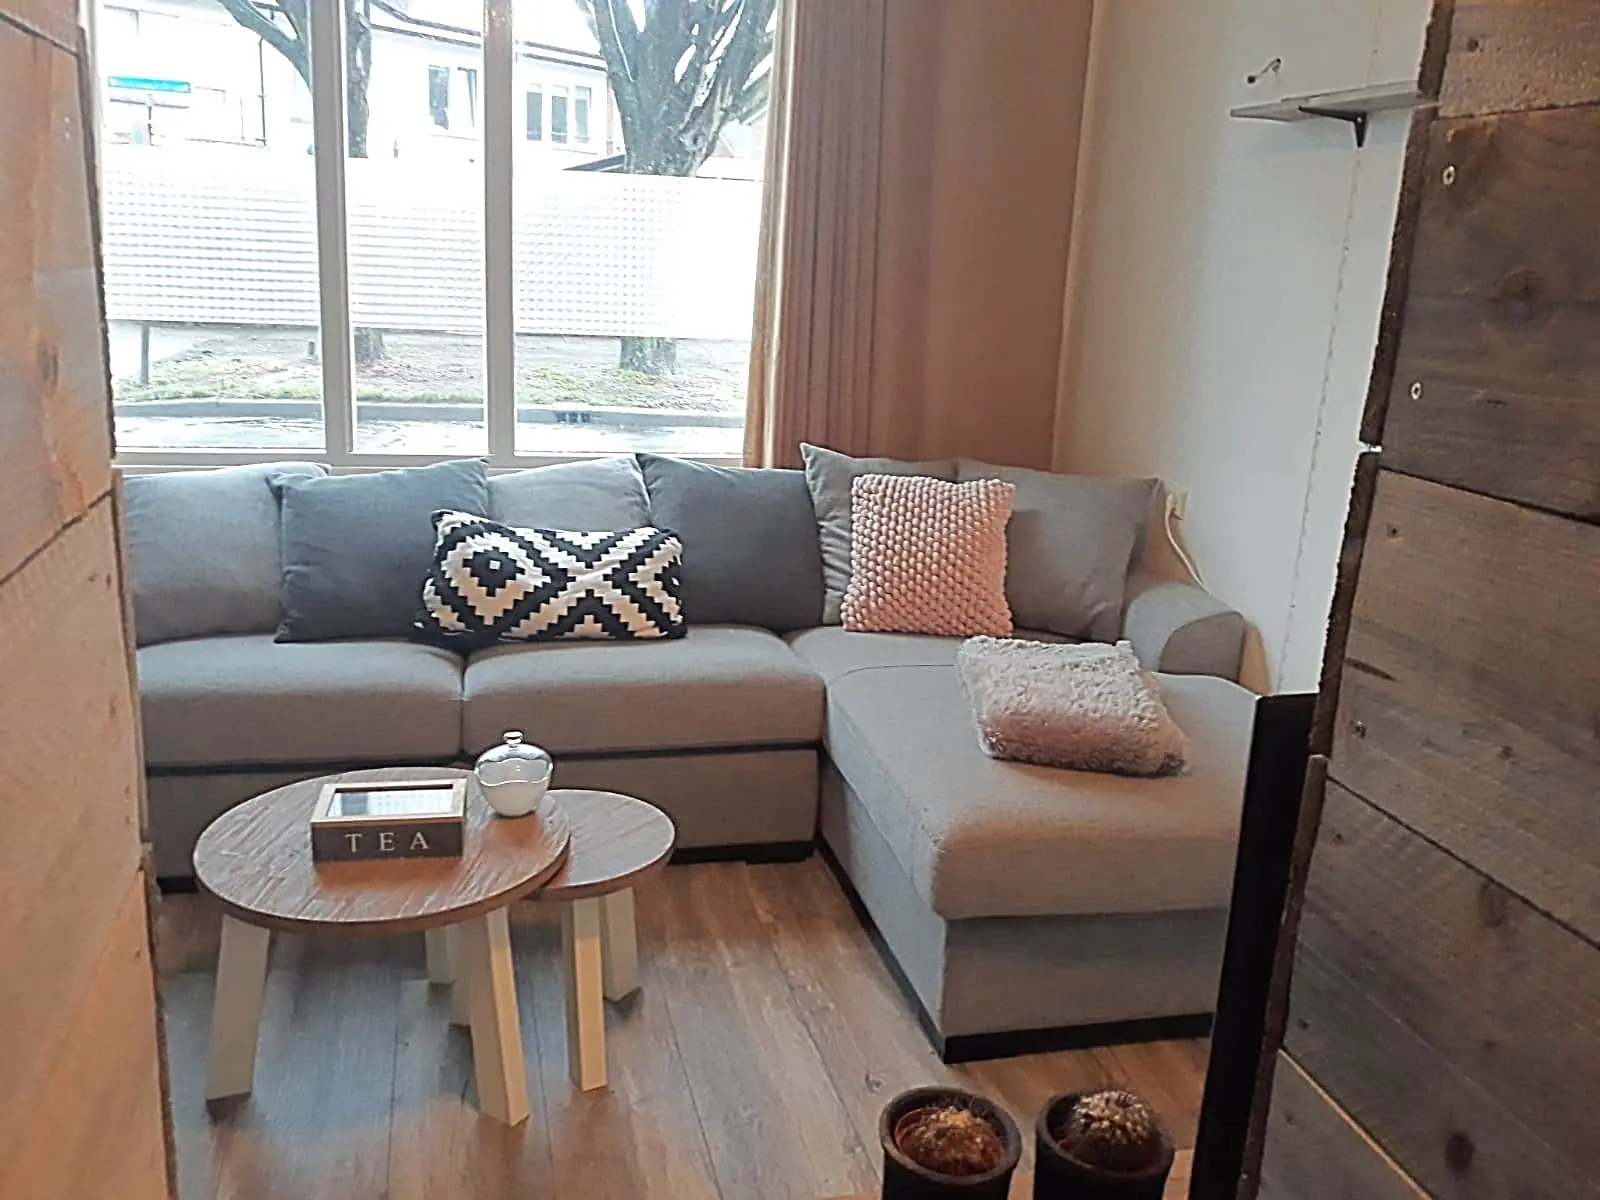
€695.00 / month
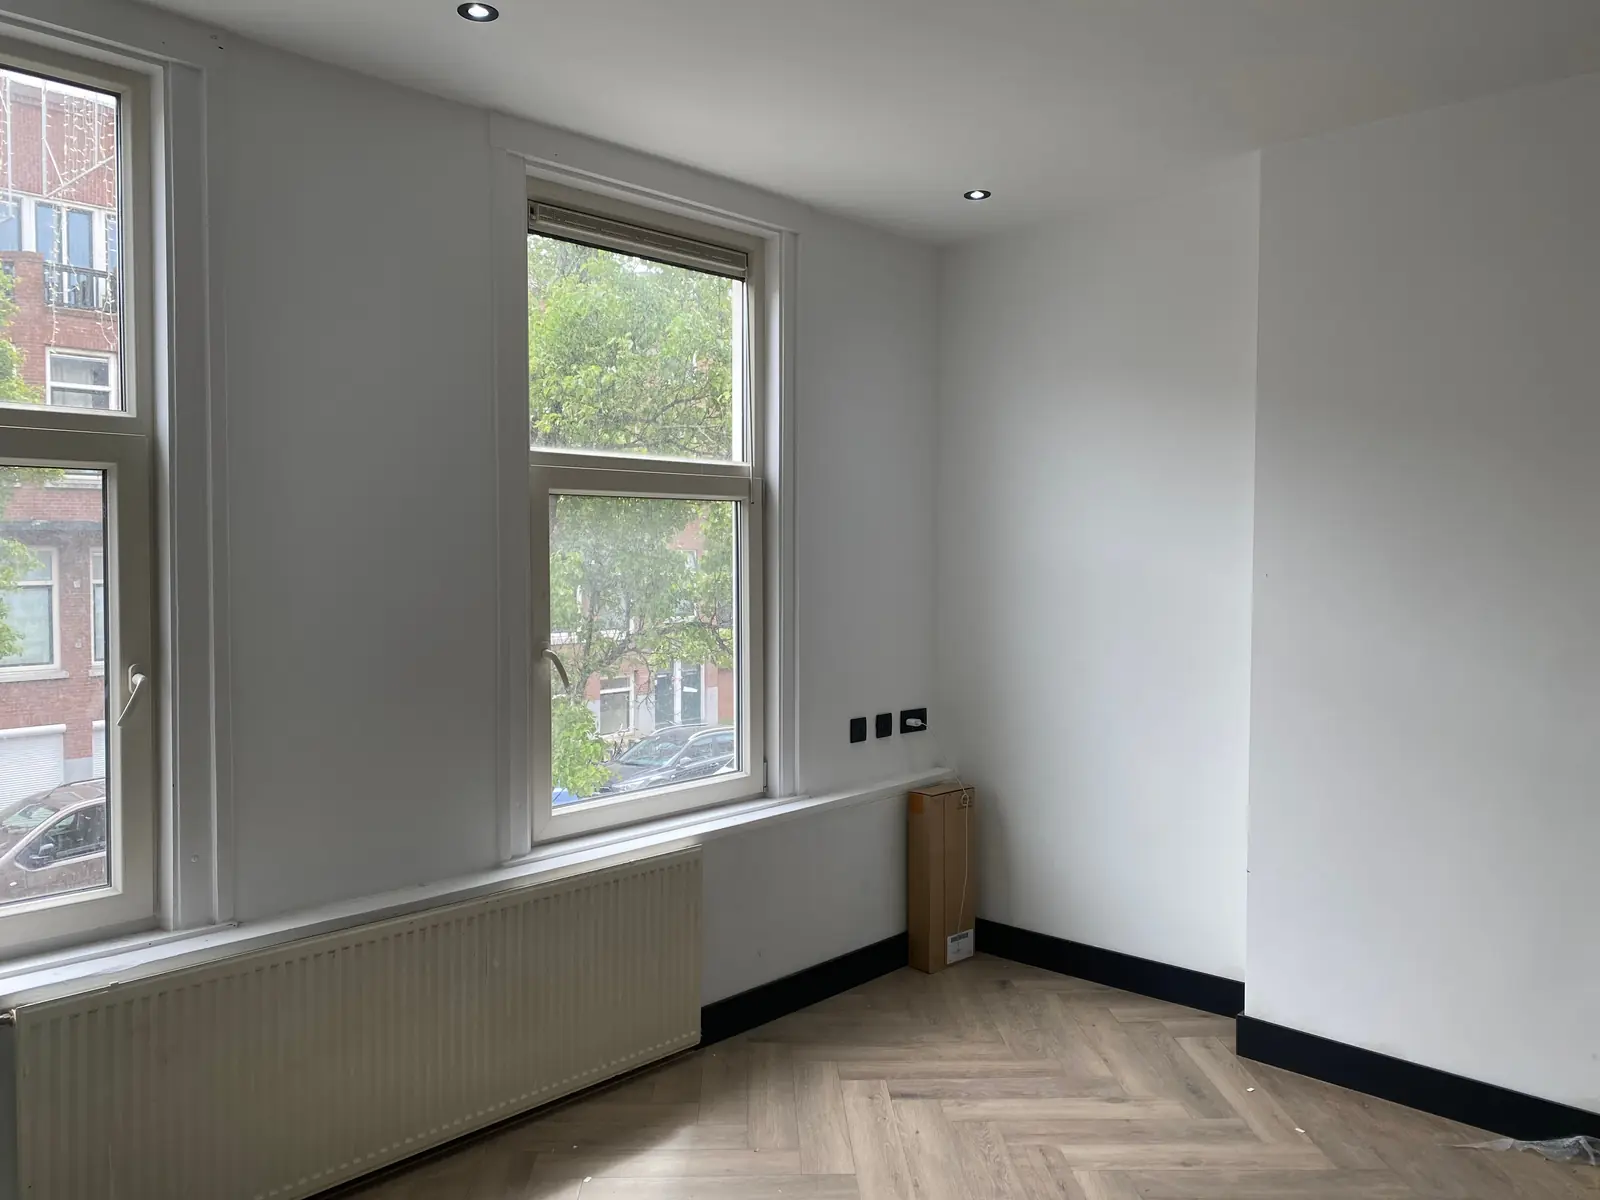
€1,500.00 / month
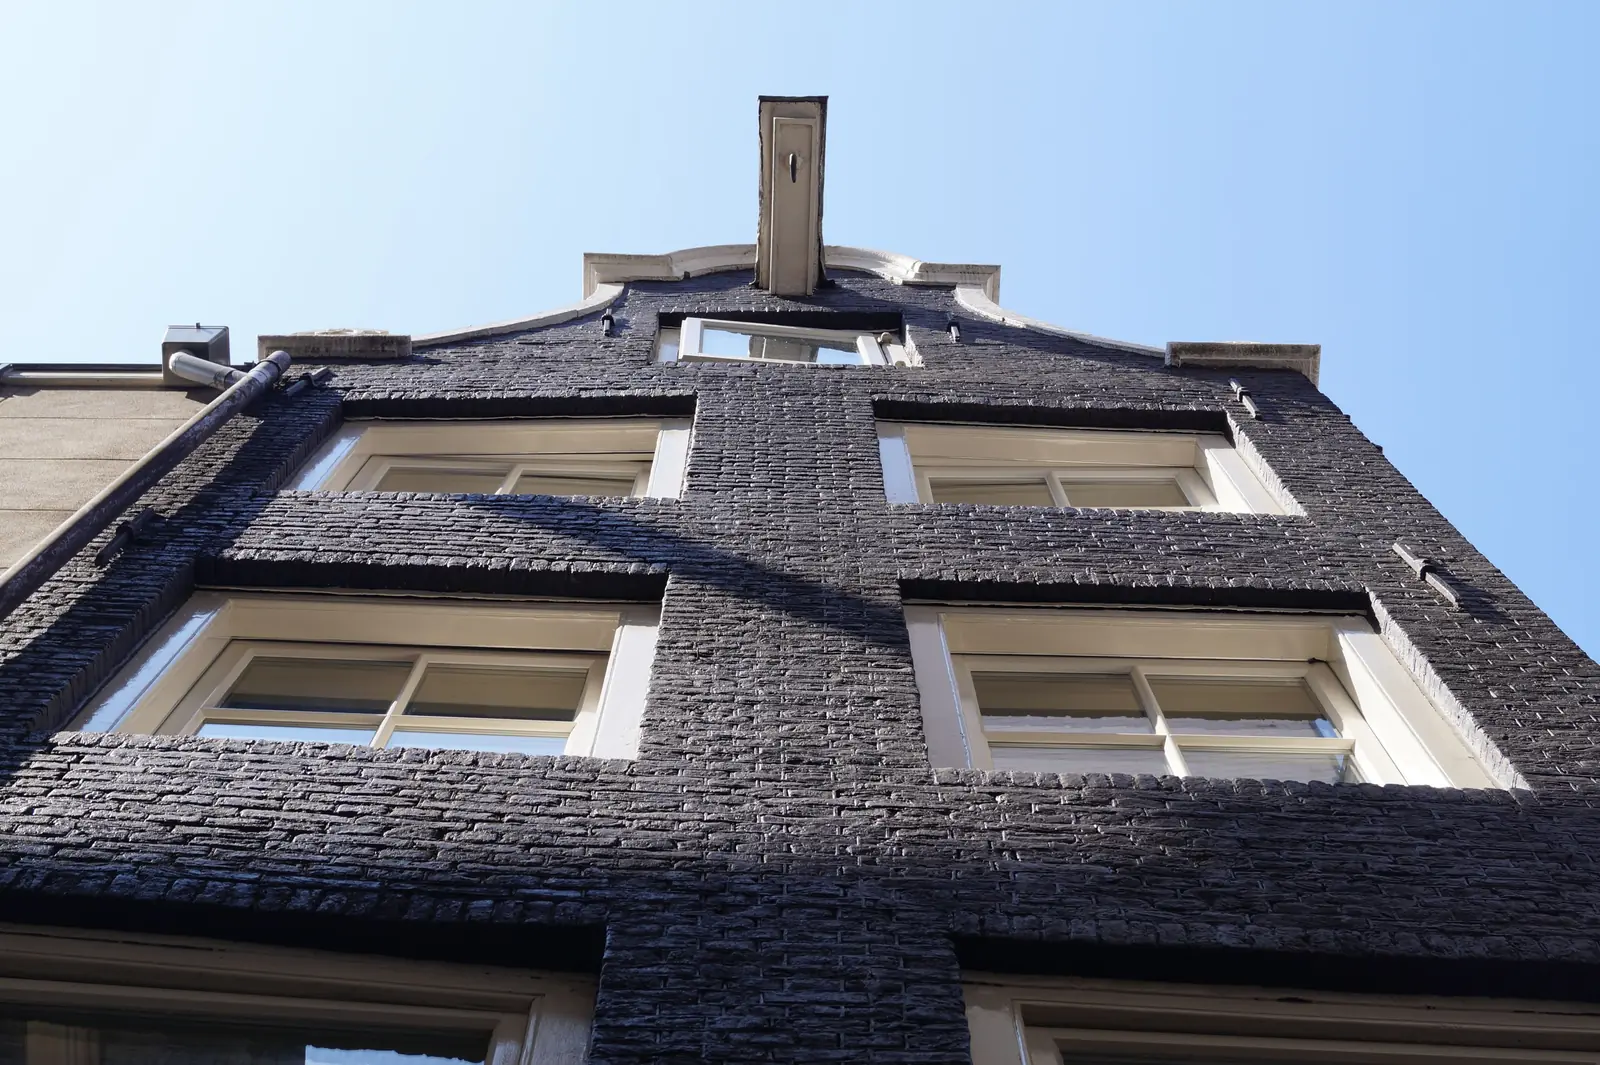
€900.00 / month
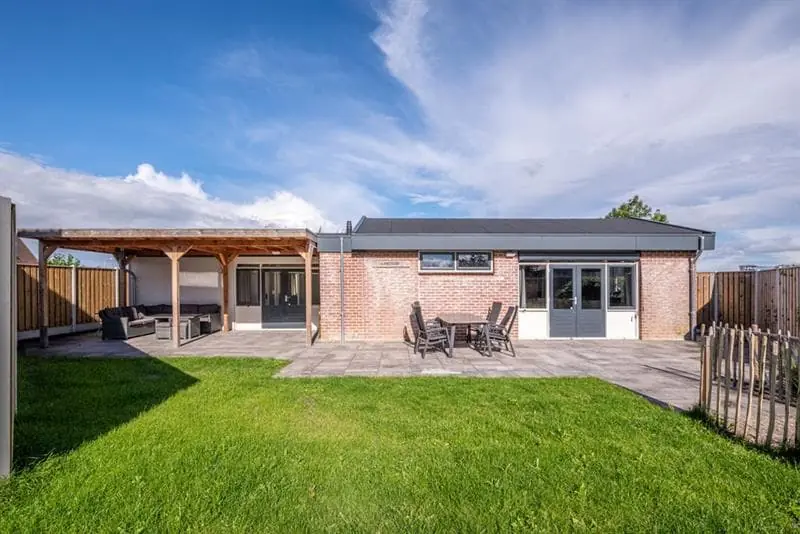
€1,500.00 / month

€1,307.00 / month
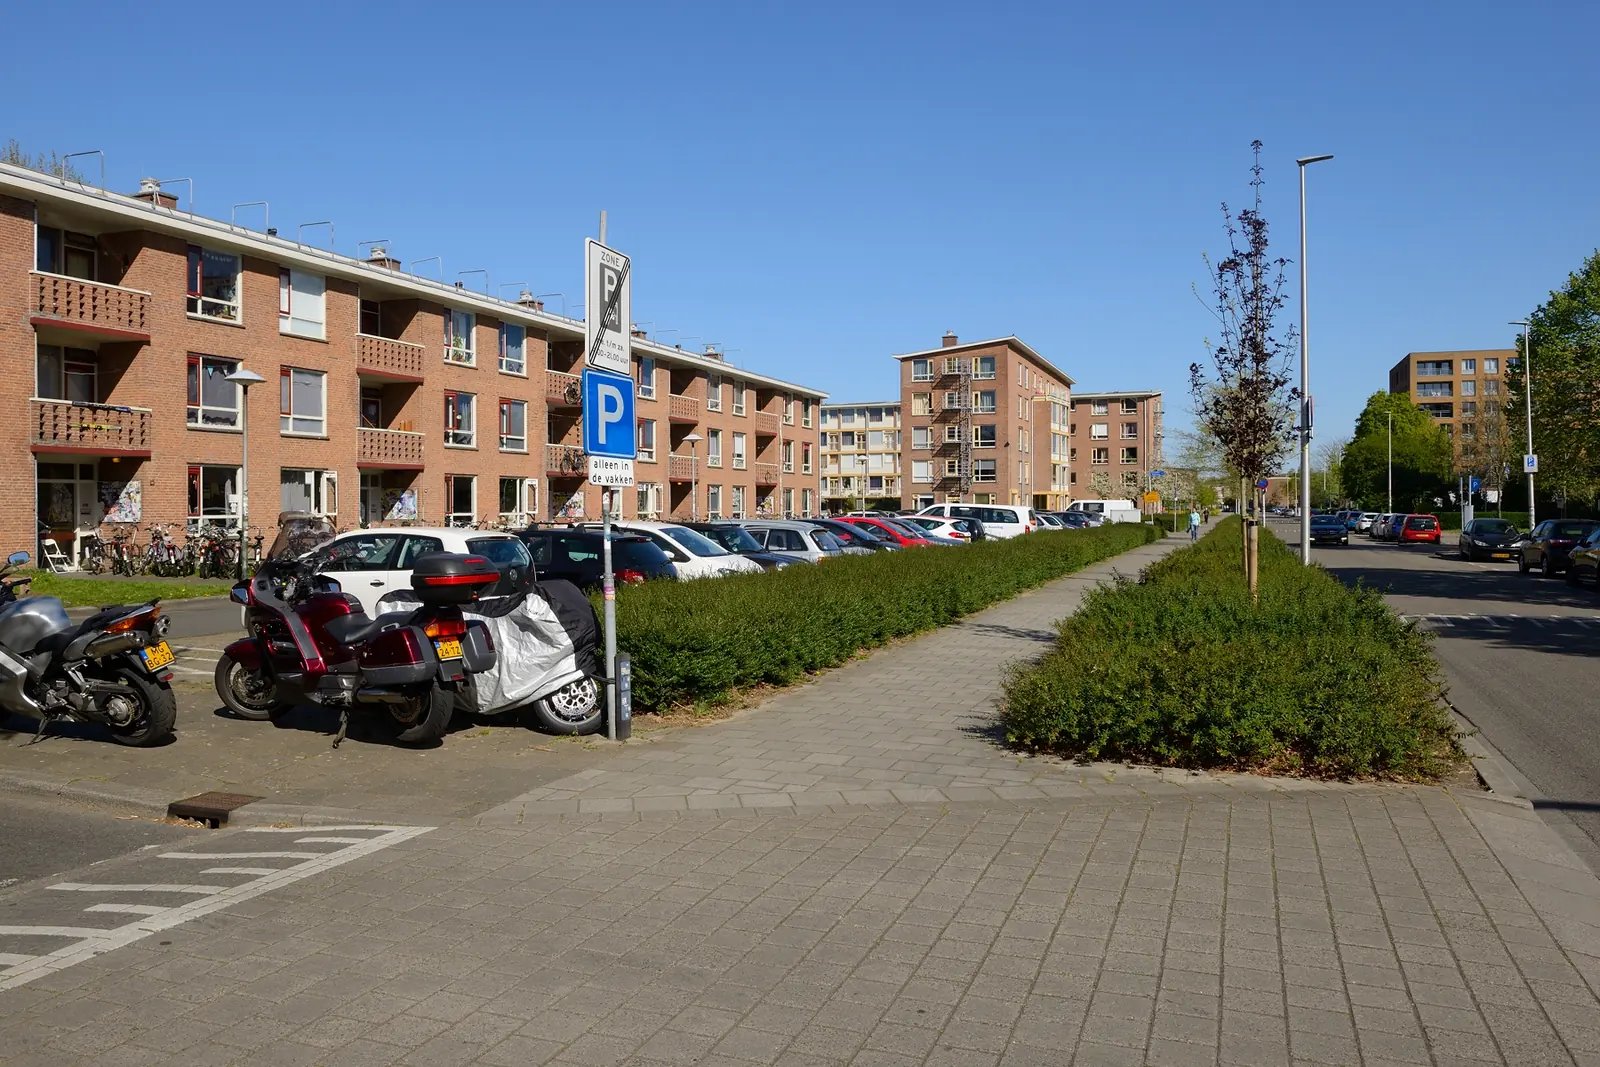
€872.00 / month
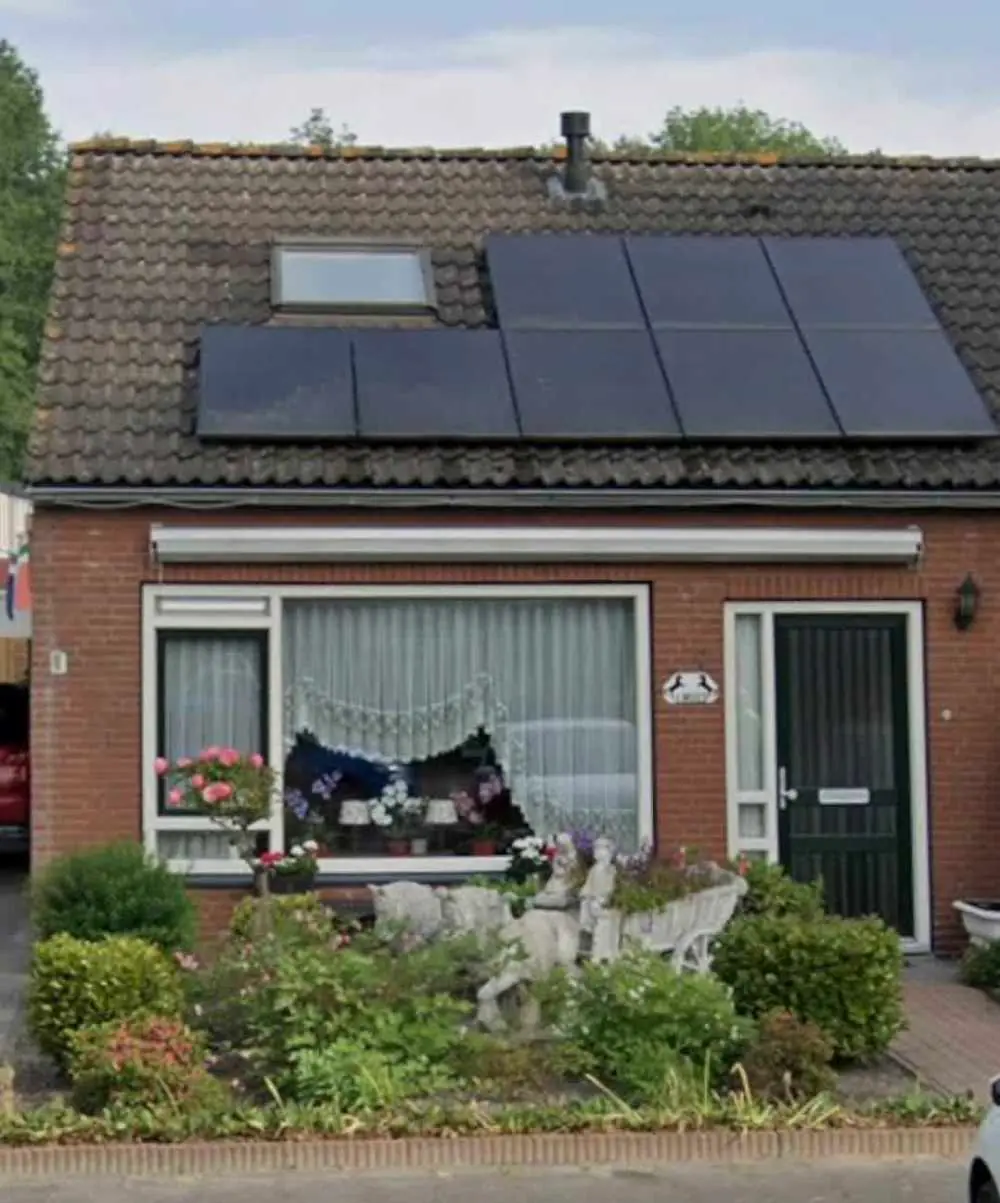
€690.00 / month
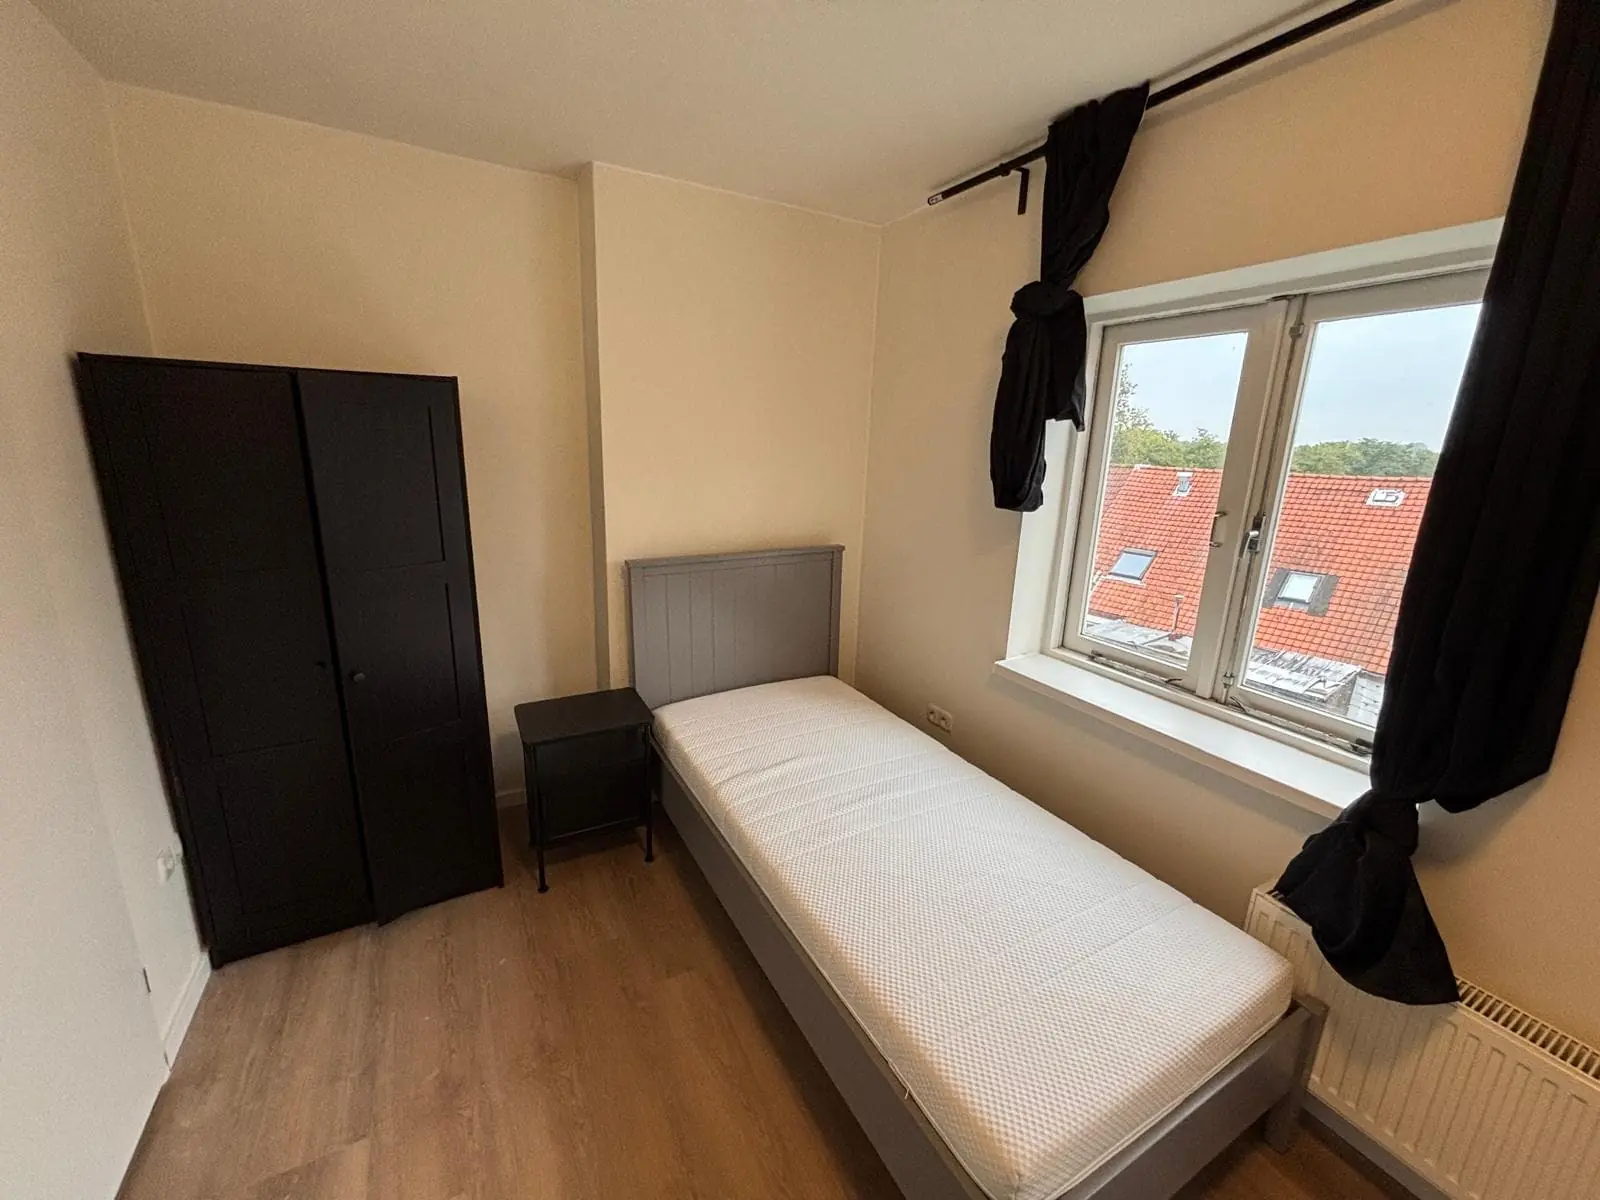
€1,150.00 / month
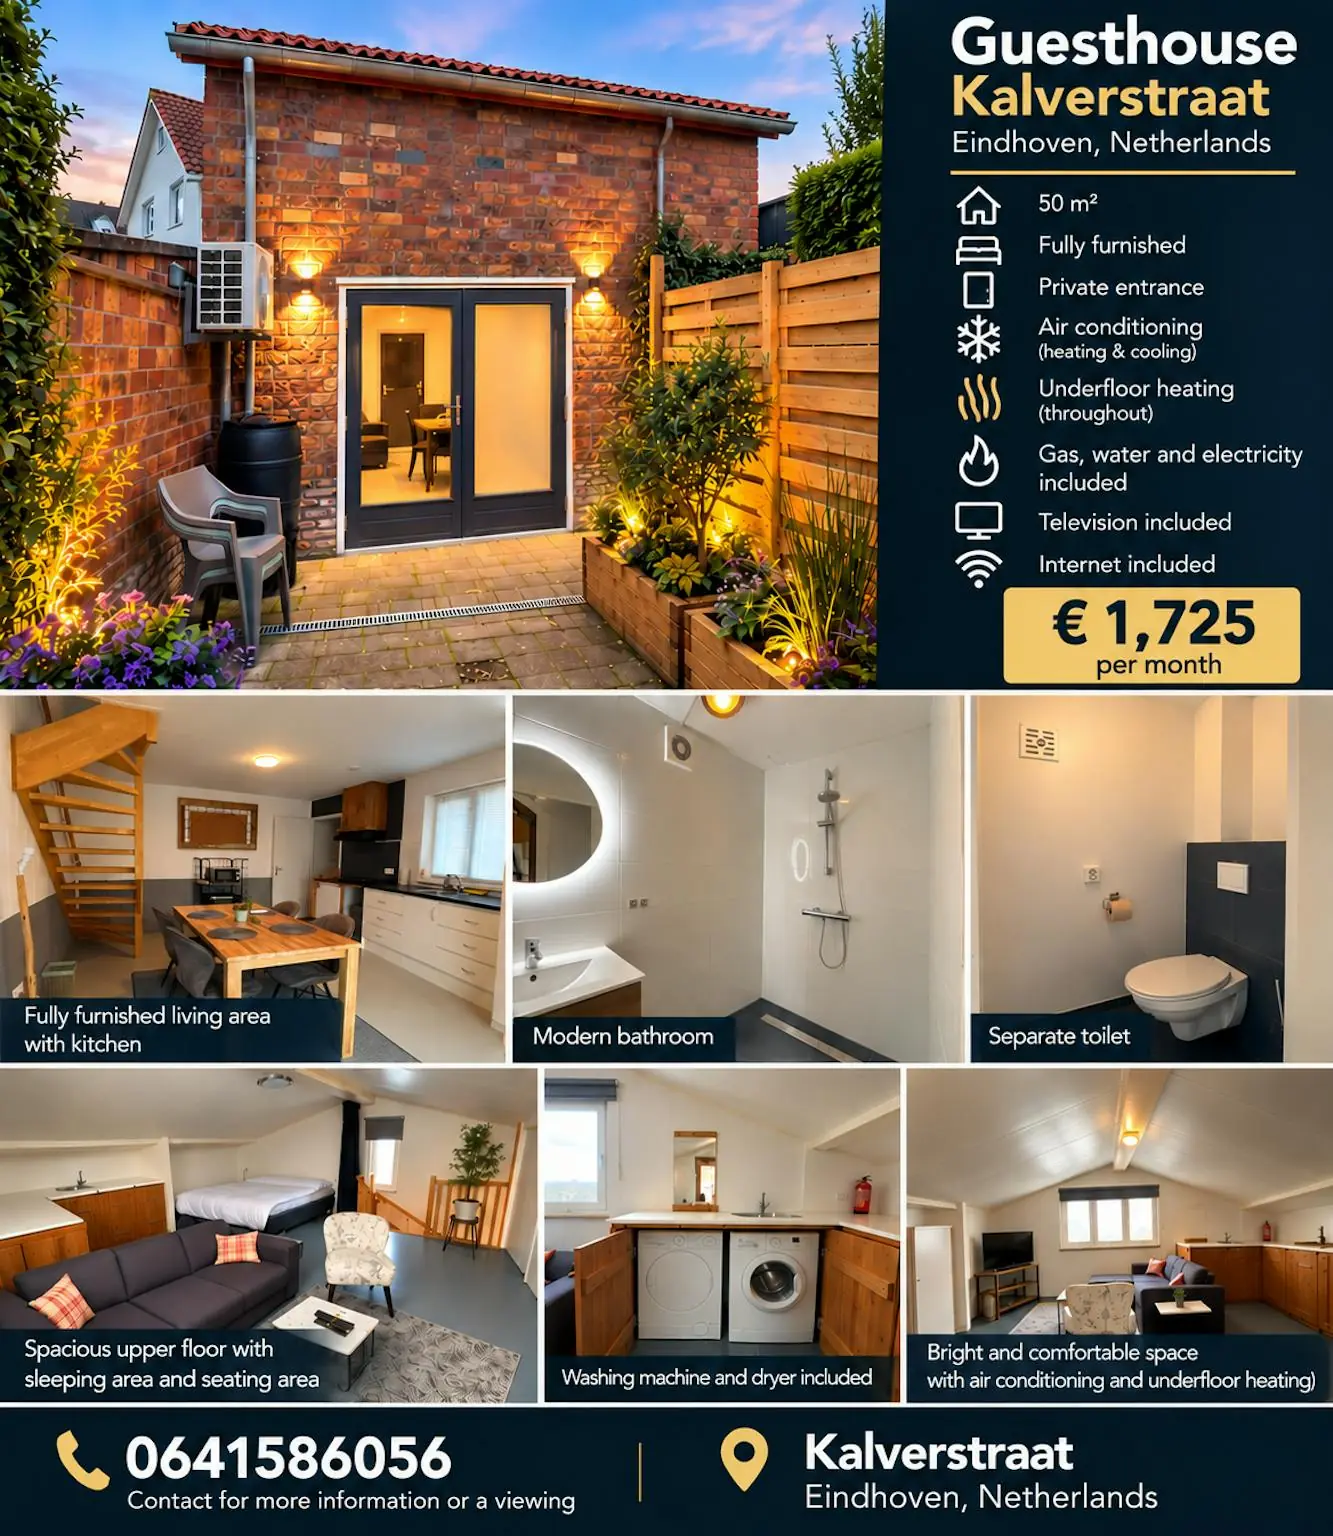
€1,725.00 / month
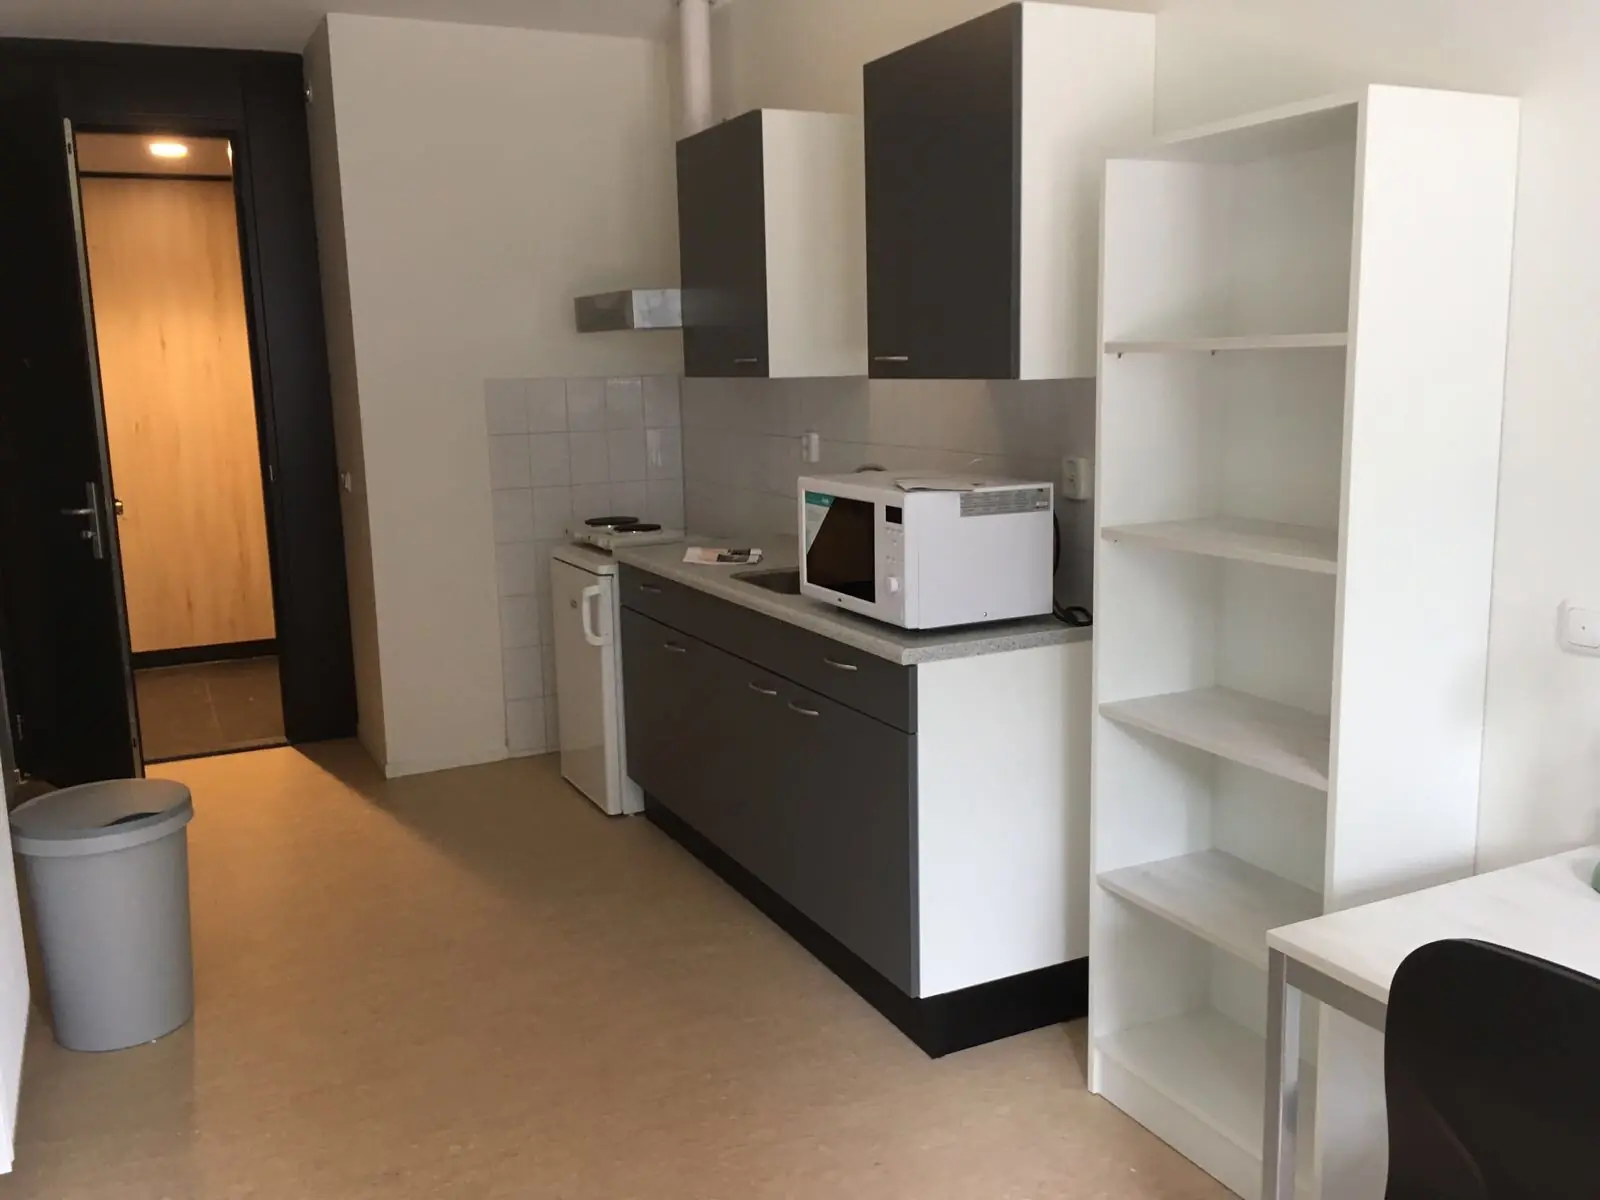
€714.00 / month
| Neighborhood | YoY growth | 3M annualized | Median rent | Listings |
|---|---|---|---|---|
| Hazenkamp | 24.3% | 86.9% | €933 | 3 |
| Smeliënkamp | 10.4% | – | €785 | 3 |
| Genooi | – | -83.7% | €714 | 3 |
| Hagerhof | – | 55.5% | €933 | 7 |
| Stalberg | – | 679.1% | €495 | 3 |
| Venlo | – | – | €714 | 5 |