















Rental market metrics
Median and average asking rent, price per square meter, time on market, supply volume and the rest of the indicator library.
Browse metricsThe Market Liquidity Index combines several signals of how quickly and consistently rental supply clears in Lisse into a comparable benchmark. It helps landlords, investors, and analysts assess whether conditions appear loose, balanced, or highly competitive without relying on time on market or active stock alone. Read it as a broad market-tightness signal, not a complete explanation of renter demand.
Use the index to compare liquidity conditions within the available Lisse market view and identify meaningful differences in market tightness. Directional movement can indicate changing competition or clearing speed, but a single index value should not be treated as a precise forecast, a guaranteed letting period, or proof of demand for every property type.
Figures come from the rental listings Luntero represents for the selected period. Sample sizes differ per location and month, so read short movements together with the underlying listing counts rather than as exact market wide changes.
The Market Liquidity Index combines several signals of how quickly and consistently rental supply clears in Lisse into a comparable benchmark. It helps landlords, investors, and analysts assess whether conditions appear loose, balanced, or highly competitive without relying on time on market or active stock alone. Read it as a broad market-tightness signal, not a complete explanation of renter demand.
The Market Liquidity Index combines several signals of how quickly and consistently rental supply clears in Lisse into a comparable benchmark. It helps landlords, investors, and analysts assess whether conditions appear loose, balanced, or highly competitive without relying on time on market or active stock alone. Read it as a broad market-tightness signal, not a complete explanation of renter demand.
A higher or lower index should be read as a relative signal of market tightness, not as a direct count of available homes.
Combining several liquidity signals can provide a steadier comparison than relying only on active stock or time on market.
Changes in the index may reflect shifts in supply composition as well as genuine changes in competitive rental conditions.
Lisse comparisons are most useful when the underlying market scope and property mix remain reasonably consistent.
The index supports screening and comparison, but it does not replace property-level pricing, quality, or demand analysis.
Explain the index as a composite alternative to single-metric market analysis.
Compare liquidity signals with the risks of reading active stock or time on market alone.
Discuss how property mix and listing composition can affect Lisse market comparisons.
Frame the measure as a screening tool for landlords, investors, and analysts.
Explore how directional changes may indicate shifting competitive conditions without forecasting outcomes.
This page documents one indicator. The Lisse overview brings the median advertised rent, cost per square metre, three trend windows, listing supply and the bedroom, property-type and furnishing mix together in a single reading.
Stay in Lisse and switch the question. The same represented listing sample powers every metric and report below, so you can move from asking rent to price per square meter, supply, space and neighbourhood detail without losing the local context.
Compare Market Liquidity Index by Location across supported Dutch locations using the represented listing sample. Differences reflect the covered sources, period and methodology and should not be treated as complete local-market or demand measurements.
Market data is most useful next to the rest of the picture. Compare a second measure, read the analysis behind it or move straight to the homes that are advertised right now.
Median and average asking rent, price per square meter, time on market, supply volume and the rest of the indicator library.
Browse metricsMulti measure analyses of pricing, supply, composition, space, affordability and market speed across the Netherlands and its cities.
Browse reportsSee the apartments, rooms and houses currently advertised in Lisse and filter them by price, size and property type.
Search Lisse rentalsHave an idea for a new housing market chart, dataset, or analysis? Submit your request and help shape the next generation of Luntero’s rental market insights. Whether it’s a new metric, city comparison, or visualization, your input helps us expand coverage of Dutch housing trends and create data tools that serve renters, investors, and researchers across the Netherlands.
Explore the latest properties added to Luntero. Find new apartments, houses, and studios across the Netherlands — updated daily to help you discover your next home faster.

€1,396.00 / month
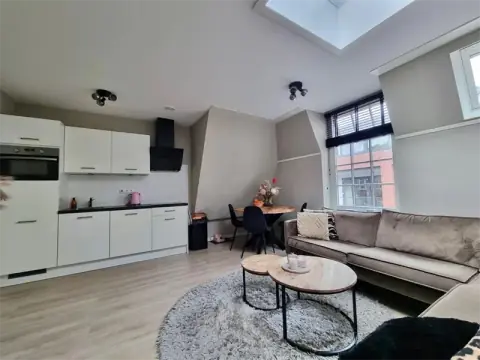
€1,425.00 / month

€1,500.00 / month

€2,300.00 / month

€722.00 / month

€870.00 / month

€1,304.00 / month

€605.00 / month
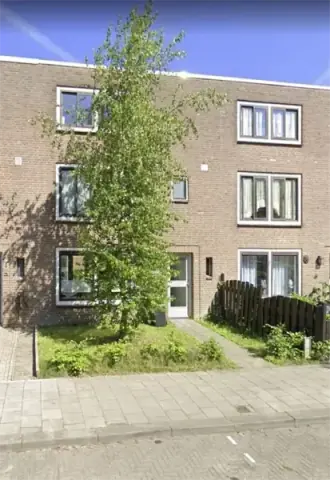
€795.00 / month

€2,850.00 / month

€2,900.00 / month
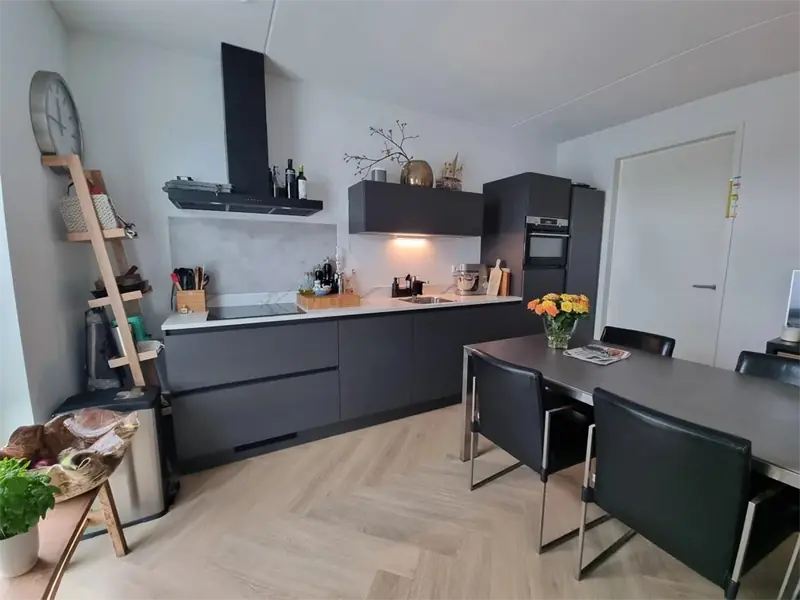
€1,895.00 / month