















Rental market reports
Multi measure analyses of pricing, supply, composition, space, affordability and market speed across the Netherlands and its cities.
Browse reportsPPM2 hotspots identify the local areas in Lisse where rental value per square meter reaches relatively high or low levels. The comparison helps show whether pricing pressure is spread across the market or concentrated in particular areas. Read the extremes as signals of relative space premiums and value pockets, not as complete measures of housing quality or affordability.
The distribution highlights how value per square meter differs across local areas of Lisse. Compare the upper and lower ends to assess the size of the space premium and whether the market appears tightly clustered or more uneven. A hotspot indicates relative pricing intensity, but it should not be read alone as a verdict on a specific area or property.
Figures come from the rental listings Luntero represents for the selected period. Sample sizes differ per location and month, so read short movements together with the underlying listing counts rather than as exact market wide changes.
PPM2 hotspots identify the local areas in Lisse where rental value per square meter reaches relatively high or low levels. The comparison helps show whether pricing pressure is spread across the market or concentrated in particular areas. Read the extremes as signals of relative space premiums and value pockets, not as complete measures of housing quality or affordability.
PPM2 hotspots identify the local areas in Lisse where rental value per square meter reaches relatively high or low levels. The comparison helps show whether pricing pressure is spread across the market or concentrated in particular areas. Read the extremes as signals of relative space premiums and value pockets, not as complete measures of housing quality or affordability.
High-value areas indicate where renters may face the steepest premium for each square meter of space.
Lower-value areas can reveal relative value pockets, but they do not automatically imply lower quality or lower total rent.
A wide spread between local extremes suggests that pricing pressure is concentrated rather than evenly distributed.
Comparing value per square meter helps separate space pricing from the effect of different home sizes.
Hotspot differences are most useful when interpreted alongside the composition of homes represented in each area.
Compare the upper and lower ends of Lisse’s local value-per-square-meter distribution.
Explain how concentrated hotspots reveal uneven rental pressure within one market.
Separate space premiums from total monthly rent and dwelling-size effects.
Discuss why lower PPM2 areas should be treated as relative value signals, not quality rankings.
Use composition effects to frame careful comparisons between local areas in Lisse.
This page documents one indicator. The Lisse overview brings the median advertised rent, cost per square metre, three trend windows, listing supply and the bedroom, property-type and furnishing mix together in a single reading.
Stay in Lisse and switch the question. The same represented listing sample powers every metric and report below, so you can move from asking rent to price per square meter, supply, space and neighbourhood detail without losing the local context.
Compare Rent per m² Hotspots by Location across supported Dutch locations using the represented listing sample. Differences reflect the covered sources, period and methodology and are not complete measurements of local supply or demand.
Market data is most useful next to the rest of the picture. Compare a second measure, read the analysis behind it or move straight to the homes that are advertised right now.
Multi measure analyses of pricing, supply, composition, space, affordability and market speed across the Netherlands and its cities.
Browse reportsMedian and average asking rent, price per square meter, time on market, supply volume and the rest of the indicator library.
Browse metricsSee the apartments, rooms and houses currently advertised in Lisse and filter them by price, size and property type.
Search Lisse rentalsHave an idea for a new housing market chart, dataset, or analysis? Submit your request and help shape the next generation of Luntero’s rental market insights. Whether it’s a new metric, city comparison, or visualization, your input helps us expand coverage of Dutch housing trends and create data tools that serve renters, investors, and researchers across the Netherlands.
Explore the latest properties added to Luntero. Find new apartments, houses, and studios across the Netherlands — updated daily to help you discover your next home faster.
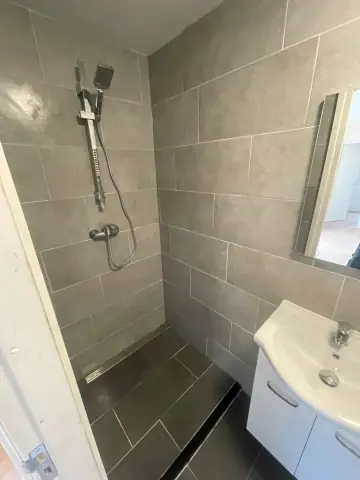
€800.00 / month
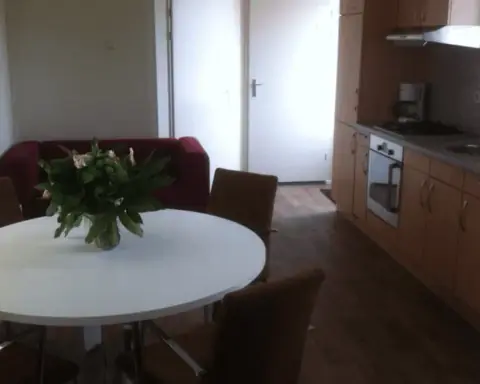
€1,150.00 / month
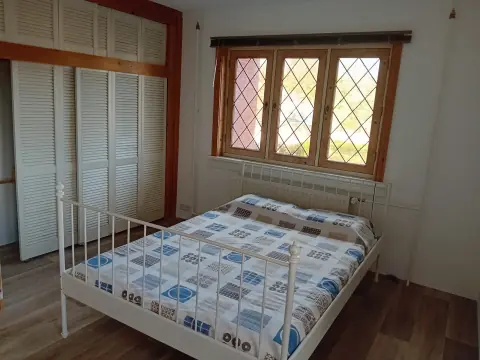
€800.00 / month
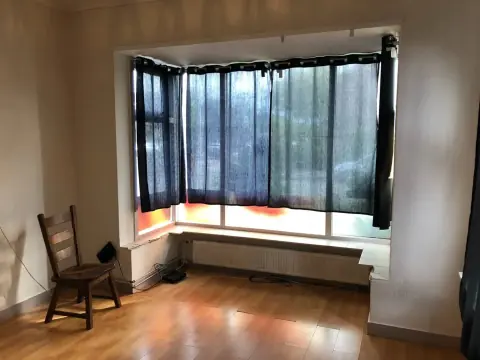
€600.00 / month
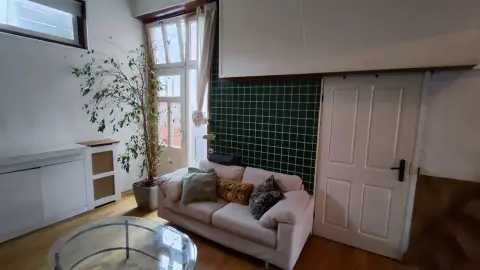
€1,050.00 / month
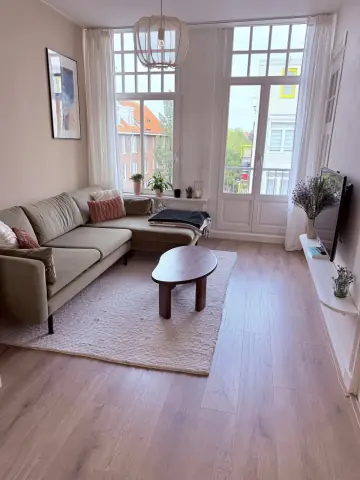
€2,000.00 / month
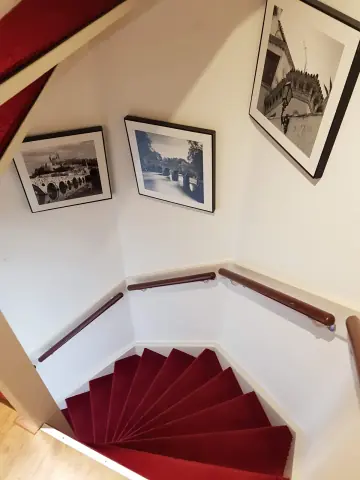
€650.00 / month
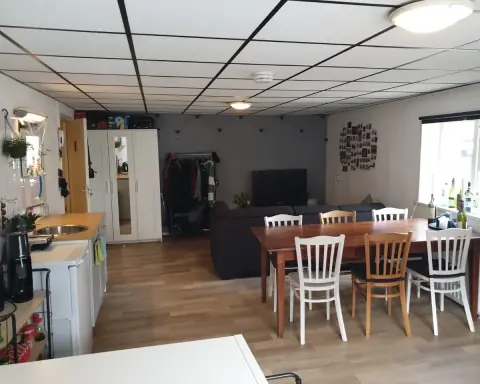
€625.00 / month
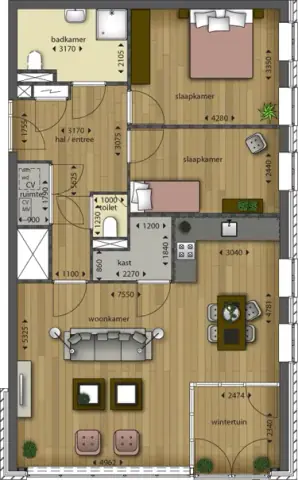
€933.00 / month
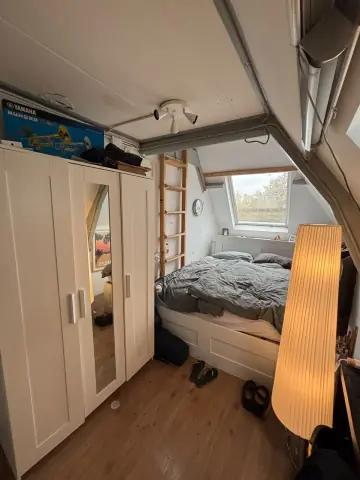
€750.00 / month
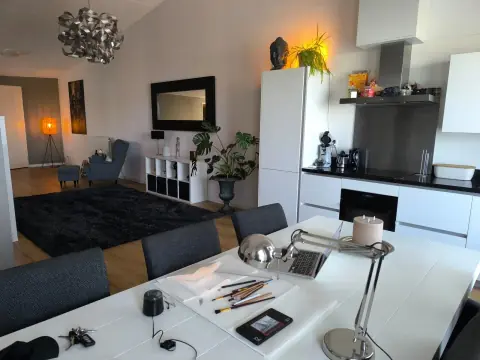
€900.00 / month
€895.00 / month