
Rental market metrics
Median and average asking rent, price per square meter, time on market, supply volume and the rest of the indicator library.
Browse metricsAverage rent summarizes advertised monthly asking prices across represented active rentals in Smallingerland. It provides a broad signal of aggregate pricing but is sensitive to every included value, so a few premium homes can pull it upward. A changing balance of apartments, houses, compact units or furnishing conditions may also move the mean without comparable homes repricing. Use it for direction rather than an individual budget and compare it with the median and rent per square metre.
The time series helps compare how advertised monthly rent in Smallingerland changes across periods. Focus on sustained movement and turning points, while considering whether the available homes have become more or less concentrated in higher-priced segments. A change in the average does not necessarily mean every rental has changed by the same amount.
Figures come from the rental listings Luntero represents for the selected period. Sample sizes differ per location and month, so read short movements together with the underlying listing counts rather than as exact market wide changes.
Average rent summarizes the advertised monthly rent across active rental listings in Smallingerland. It offers a broad view of pricing pressure and can show whether the market is becoming more expensive in aggregate. Read it as a market signal rather than a precise measure of what a typical renter will pay, because changes in the mix of homes can shift the average.
See how represented Smallingerland asking rents average over time. Premium listings and shifts between compact and larger homes can move the broad mean without like-for-like repricing.
Average rent provides a broad signal of pricing pressure across advertised homes in Smallingerland.
A rising average may reflect more expensive homes entering the market, not uniform increases across all rentals.
Comparing periods can reveal whether aggregate advertised pricing is moving upward, downward, or remaining stable.
The measure is useful for market context but should not be treated as the exact rent for a typical household.
Changes in listing composition can make short-term movements appear stronger than underlying pricing shifts.
Separate broad pricing pressure from changes in the mix of advertised homes.
Use time-series movement to distinguish sustained trends from short-term average shifts.
Explain why premium listings can influence the market-wide average disproportionately.
Frame the metric for renters, landlords, and analysts with different decision needs.
Compare aggregate rent direction without treating the average as a typical household budget.
This page documents one indicator. The Smallingerland overview brings the median advertised rent, cost per square metre, three trend windows, listing supply and the bedroom, property-type and furnishing mix together in a single reading.
Stay in Smallingerland and switch the question. The same represented listing sample powers every metric and report below, so you can move from asking rent to price per square meter, supply, space and neighbourhood detail without losing the local context.
Compare Average Rent by Location across supported Dutch locations using the represented listing sample. Differences reflect the covered sources, period and methodology and should not be treated as complete local-market or demand measurements.
Read the mean alongside median rent, home size and per-square-metre pricing, then compare the equivalent national trend.
Median and average asking rent, price per square meter, time on market, supply volume and the rest of the indicator library.
Browse metricsMulti measure analyses of pricing, supply, composition, space, affordability and market speed across the Netherlands and its cities.
Browse reportsSee the apartments, rooms and houses currently advertised in Smallingerland and filter them by price, size and property type.
Search Smallingerland rentalsHave an idea for a new housing market chart, dataset, or analysis? Submit your request and help shape the next generation of Luntero’s rental market insights. Whether it’s a new metric, city comparison, or visualization, your input helps us expand coverage of Dutch housing trends and create data tools that serve renters, investors, and researchers across the Netherlands.
Explore the latest properties added to Luntero. Find new apartments, houses, and studios across the Netherlands — updated daily to help you discover your next home faster.
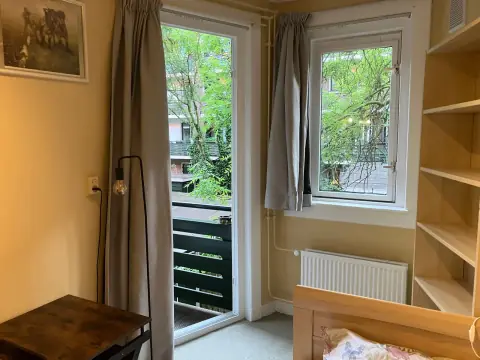
€800.00 / month
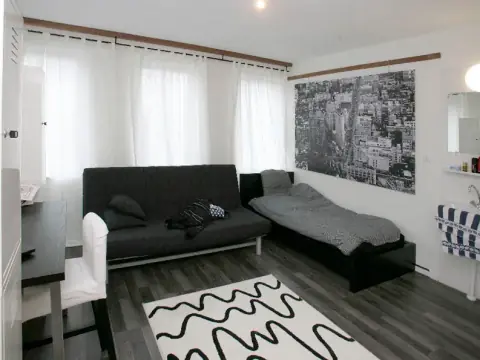
€714.00 / month
€827.00 / month
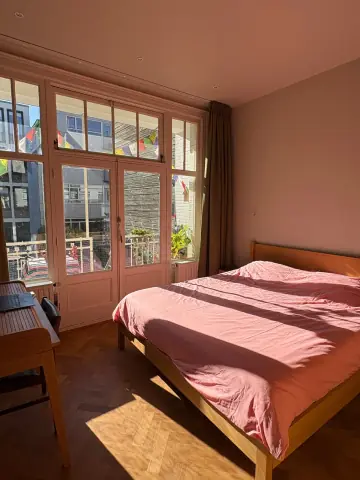
€1,675.00 / month
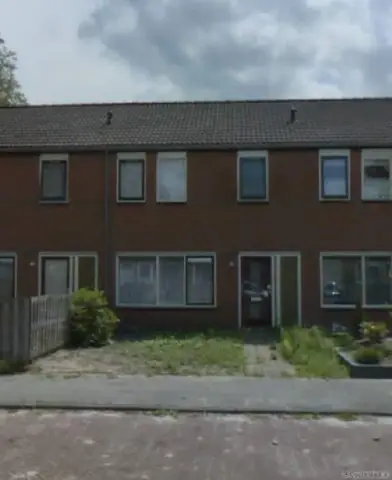
€717.00 / month
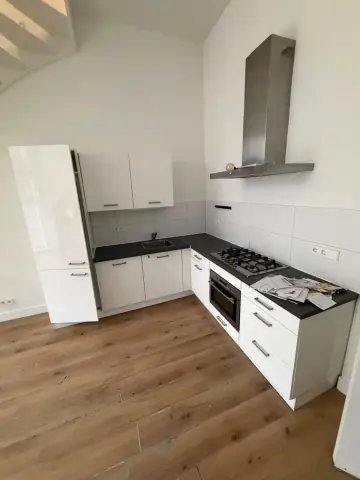
€750.00 / month
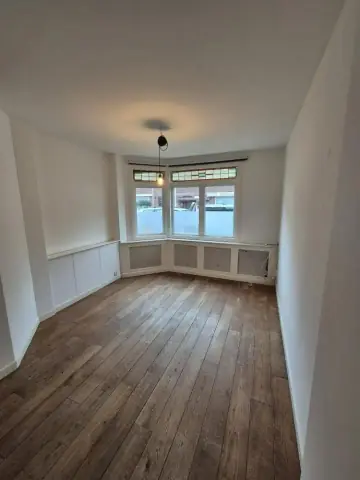
€675.00 / month

€1,006.00 / month
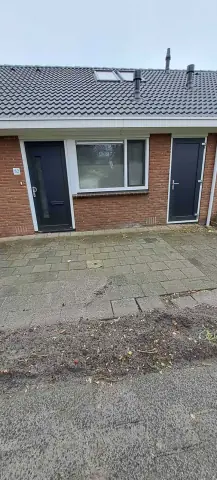
€714.00 / month
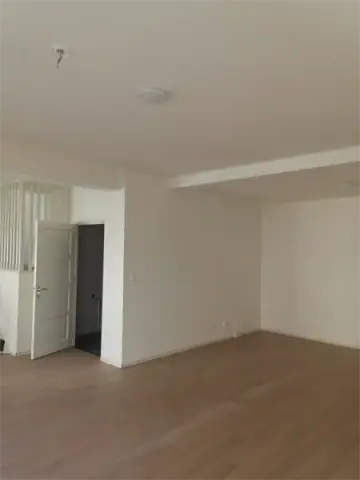
€1,055.00 / month

€1,450.00 / month
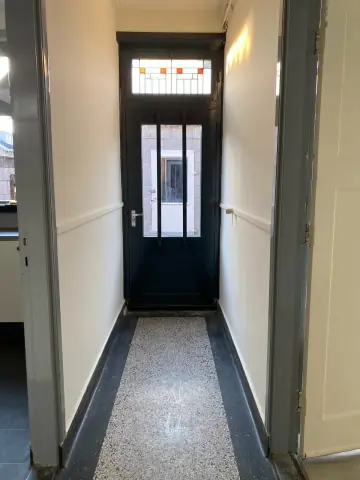
€758.00 / month