
Rental market reports
Multi measure analyses of pricing, supply, composition, space, affordability and market speed across the Netherlands and its cities.
Browse reportsSpace value bands show how rental homes cluster by size and rent per square meter rather than by a single average. Space Value Bands in Meppel is most informative when recency, observation count, and geography are read together. In Meppel, that helps separate compact homes that still command premium pricing from larger homes that offer more space for the money. The pattern is useful for judging value, but it should be read as a distribution, not a simple ranking.
Compare the bands to see where Meppel’s rental stock concentrates across size and price combinations. Strong value usually appears where larger homes sit in moderate price bands, while weaker value shows up when modest-sized homes remain expensive per square metre. Avoid reading one band in isolation, because the mix of property types can shape the pattern.
Figures come from the rental listings Luntero represents for the selected period. Sample sizes differ per location and month, so read short movements together with the underlying listing counts rather than as exact market wide changes.
Space value bands show how rental homes cluster by size and price per square metre rather than by a single average. In Meppel, that helps separate compact homes that still command premium pricing from larger homes that offer more space for the money. The pattern is useful for judging value, but it should be read as a distribution, not a simple ranking.
Review Space Value Bands — Meppel when the decision requires context across several compatible measures instead of one headline value. Move from the displayed result on Space Value Bands in Meppel to housing mix, comparison, and publication date before interpreting the pattern.
Bands help show whether Meppel’s rental stock rewards extra space with better value or keeps larger homes firmly priced up.
Compact homes can still sit in premium bands, so size alone does not guarantee lower rent per square metre.
A broad spread across bands often signals mixed stock, while tight clustering suggests a more uniform rental offer.
Comparisons work best when looking at how Meppel’s bands differ from other Dutch locations with similar market roles.
The most useful signal is where price and space align, not where a single average appears to land.
Explain which size-price clusters look most efficient in Meppel’s rental market.
Show how compact high-priced homes differ from larger value-oriented rentals.
Compare Meppel’s band structure with other Dutch locations to judge relative value.
Use the distribution to spot whether the market is balanced or skewed toward one segment.
Discuss how stock composition can make some bands look expensive without implying the whole market is overpriced.
This page documents one indicator. The Meppel overview brings the median advertised rent, cost per square metre, three trend windows, listing supply and the bedroom, property-type and furnishing mix together in a single reading.
Stay in Meppel and switch the question. The same represented listing sample powers every metric and report below, so you can move from asking rent to price per square meter, supply, space and neighbourhood detail without losing the local context.
Compare Space Value Bands by Location across supported Dutch locations using the represented listing sample. Differences reflect the covered sources, period and methodology and are not complete measurements of local supply or demand.
Read Space Value Bands in Meppel as a signal shaped by observation count, unit, and source, rather than a complete market verdict. Use space value bands in Meppel to identify the next market question, then examine the national pattern and underlying indicators before reaching a conclusion.
Multi measure analyses of pricing, supply, composition, space, affordability and market speed across the Netherlands and its cities.
Browse reportsMedian and average asking rent, price per square meter, time on market, supply volume and the rest of the indicator library.
Browse metricsSee the apartments, rooms and houses currently advertised in Meppel and filter them by price, size and property type.
Search Meppel rentalsHave an idea for a new housing market chart, dataset, or analysis? Submit your request and help shape the next generation of Luntero’s rental market insights. Whether it’s a new metric, city comparison, or visualization, your input helps us expand coverage of Dutch housing trends and create data tools that serve renters, investors, and researchers across the Netherlands.
Explore the latest properties added to Luntero. Find new apartments, houses, and studios across the Netherlands — updated daily to help you discover your next home faster.
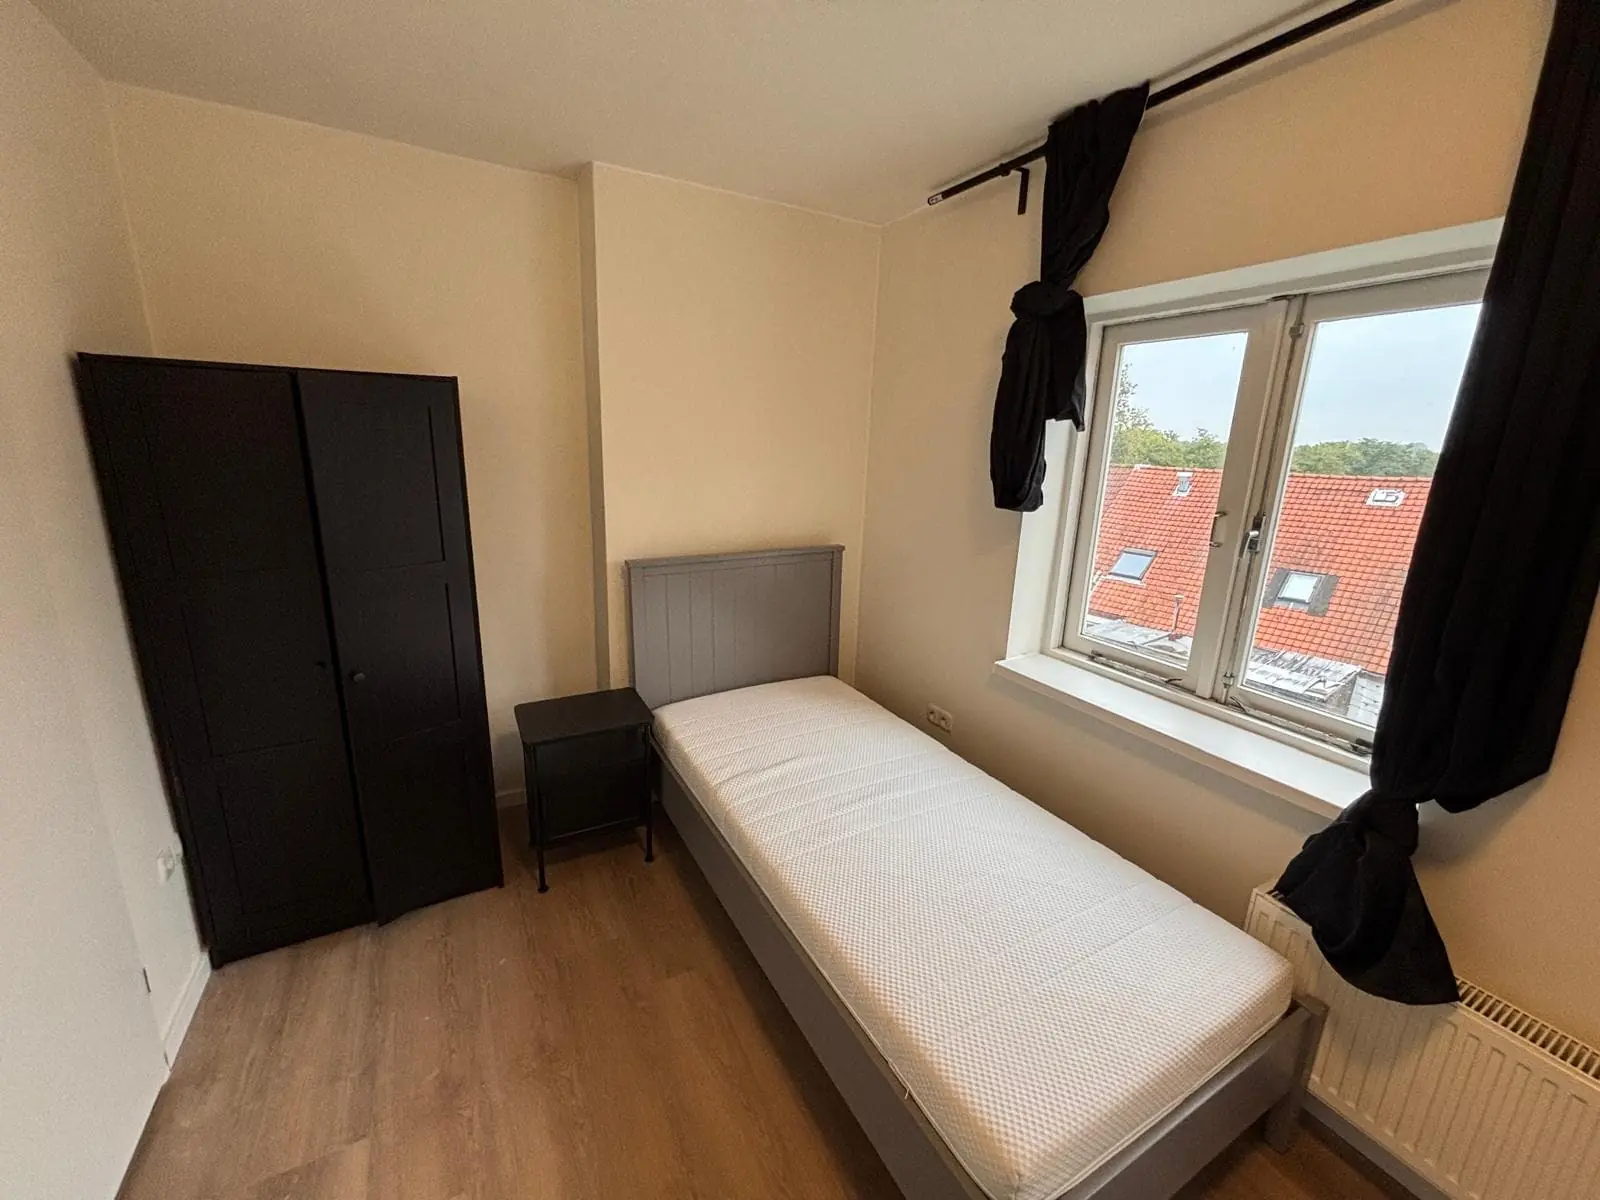
€1,150.00 / month
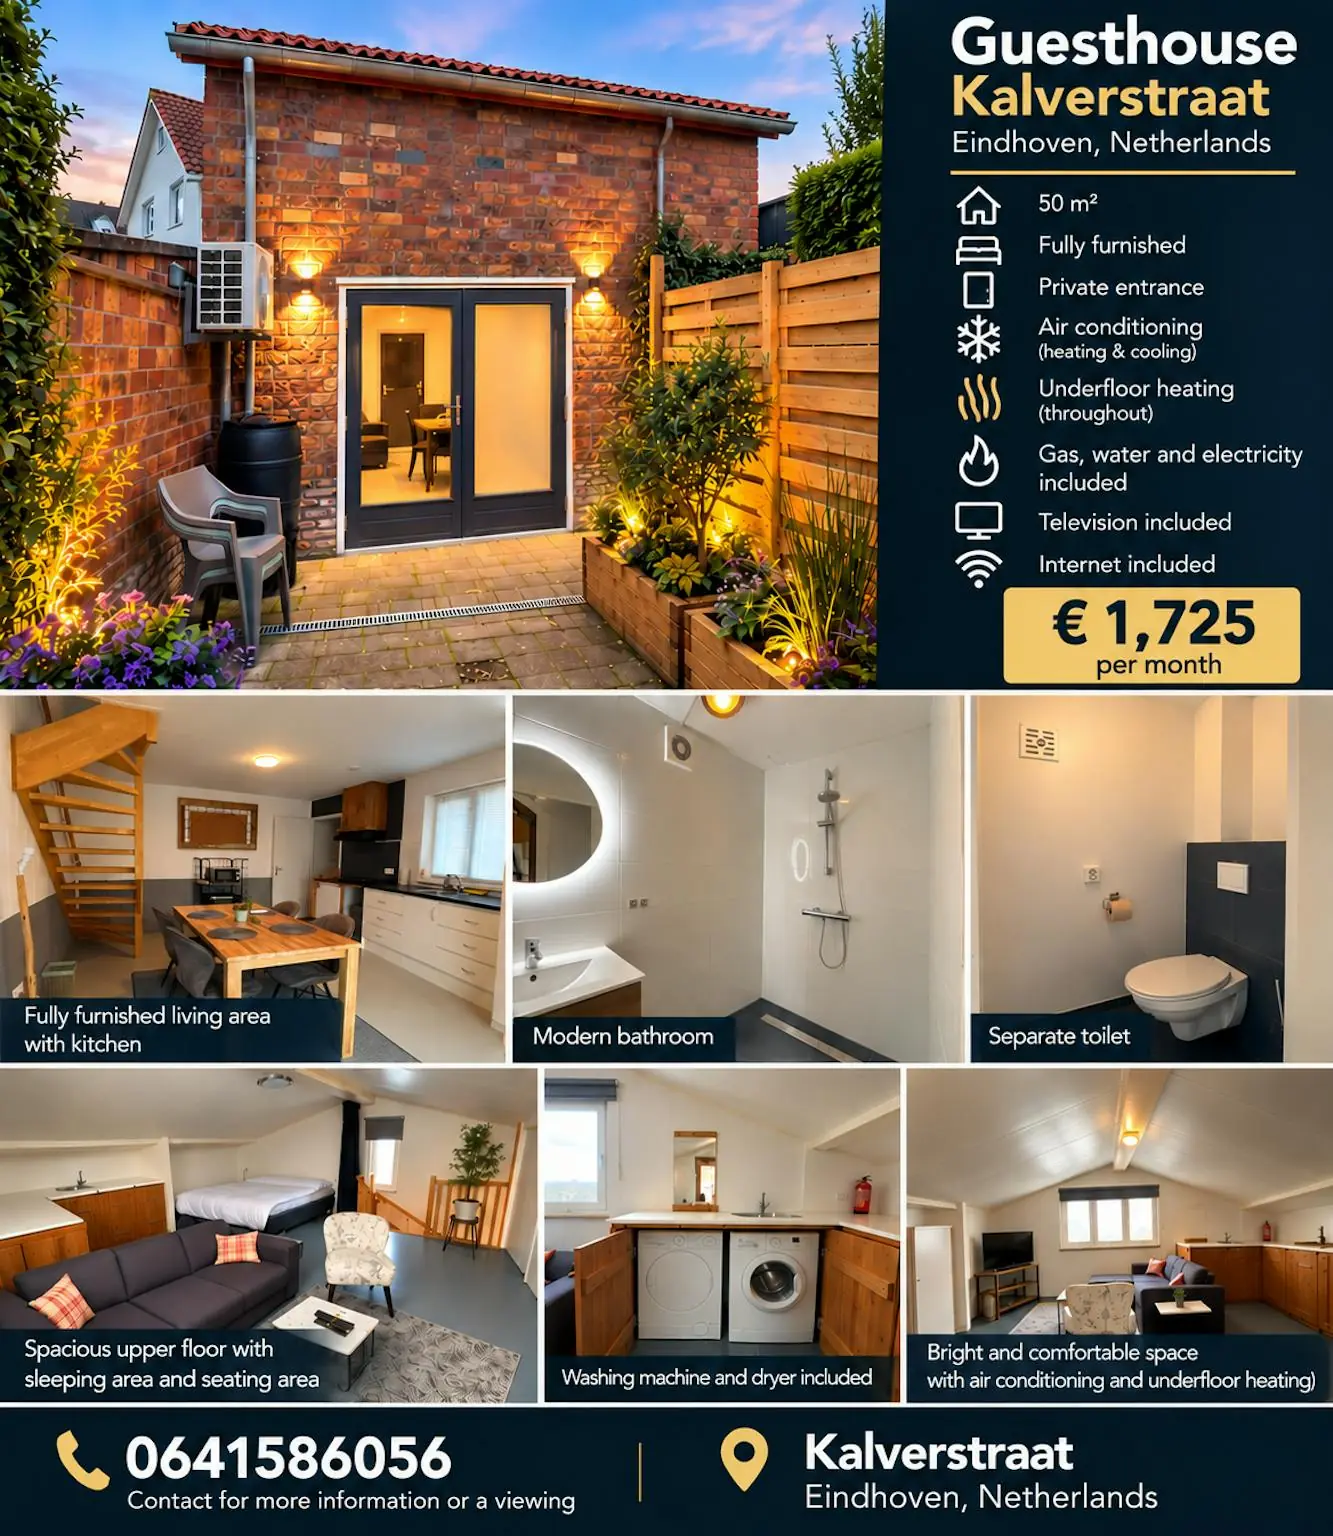
€1,725.00 / month
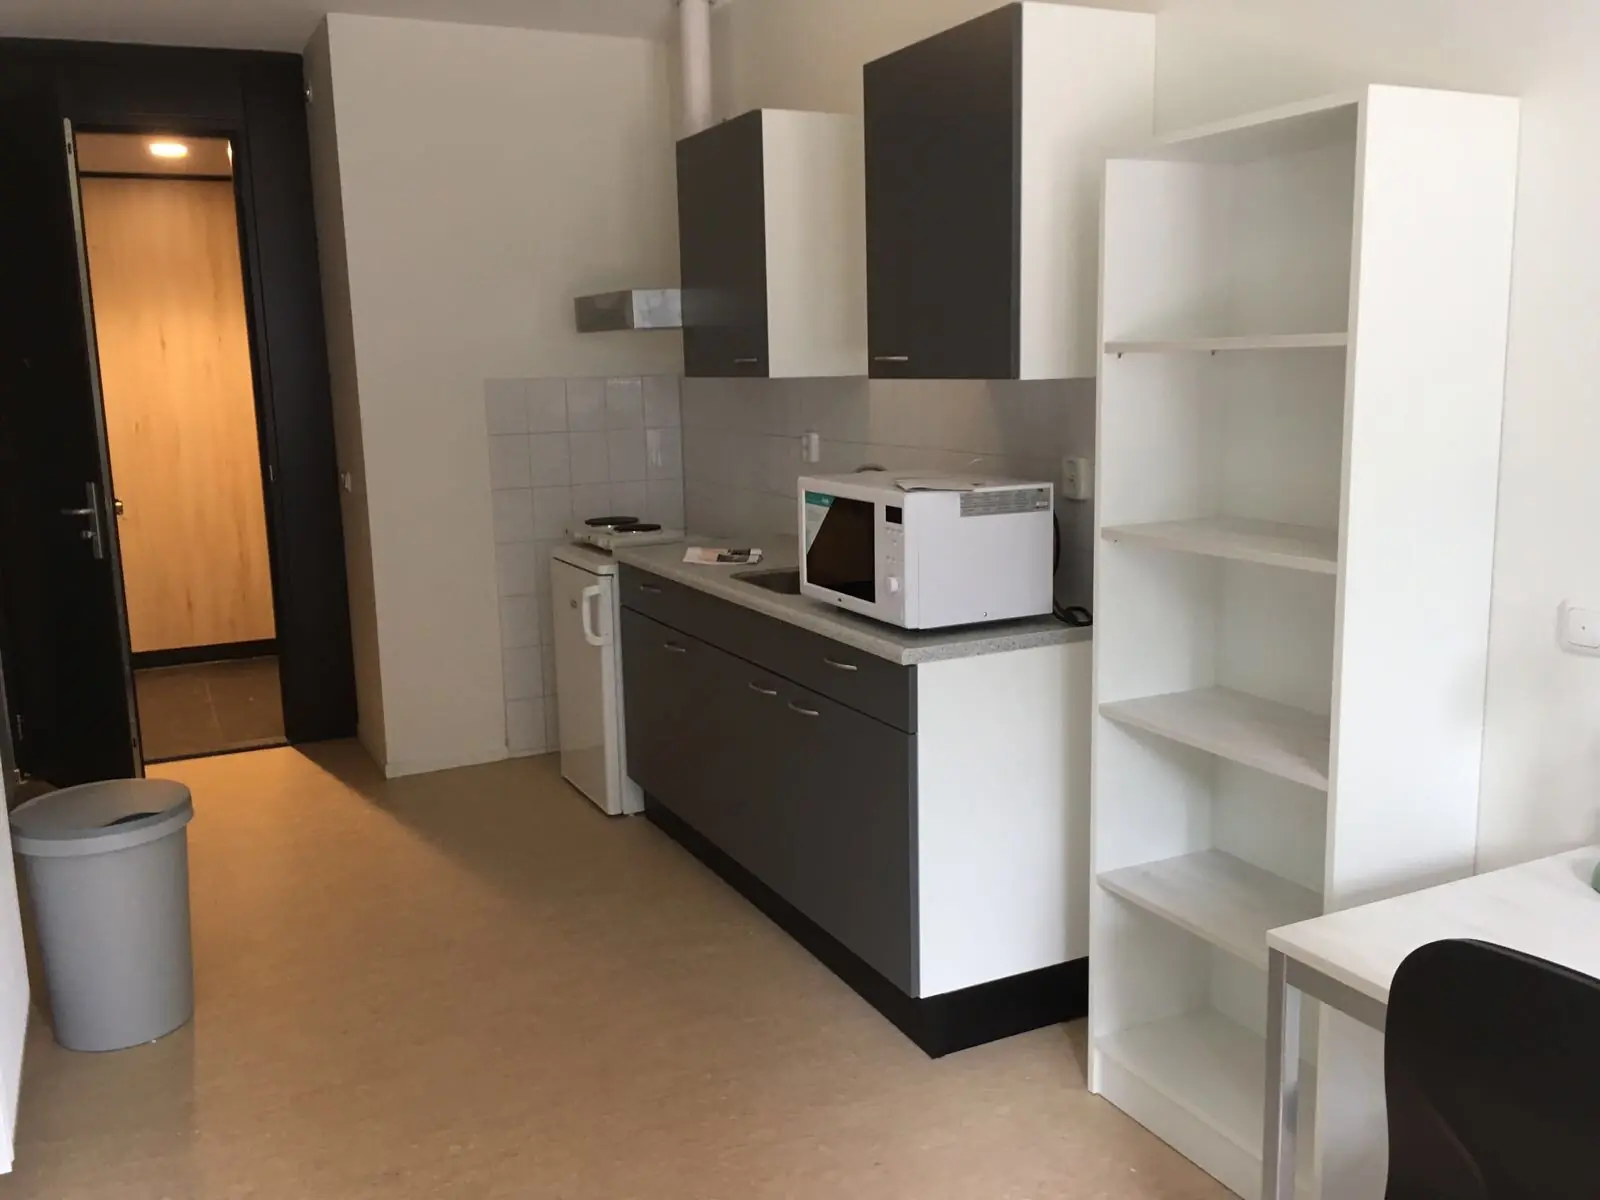
€714.00 / month
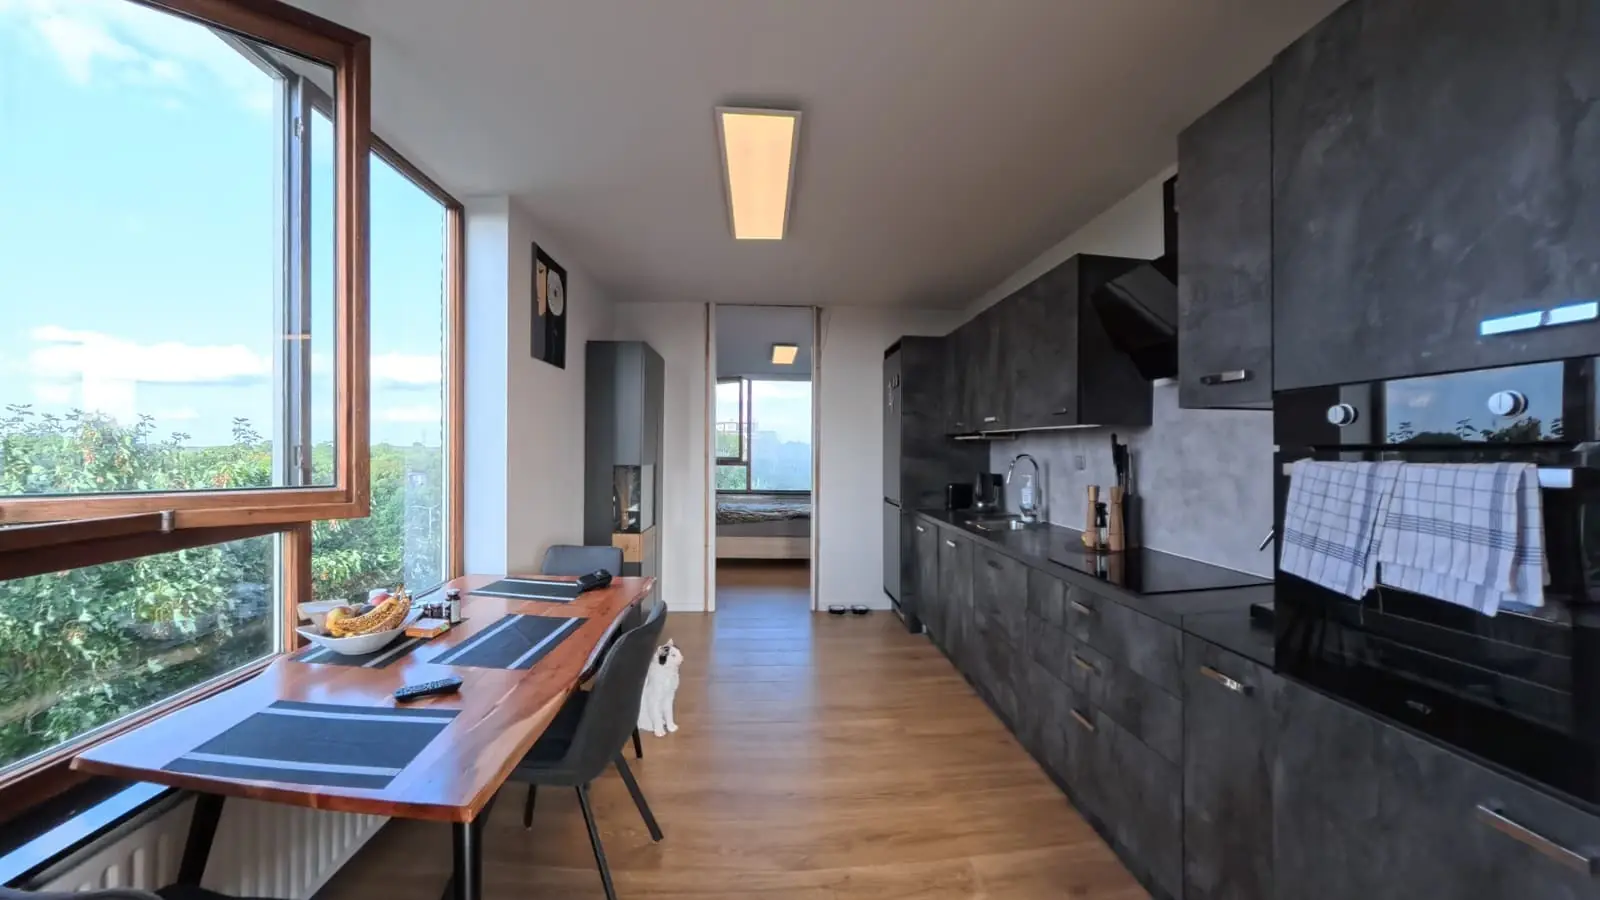
€2,200.00 / month

€653.00 / month

€1,930.00 / month
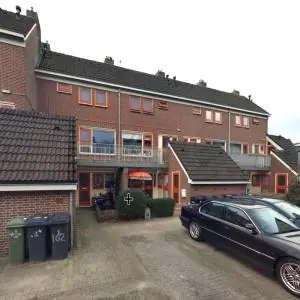
€815.00 / month

€1,280.00 / month
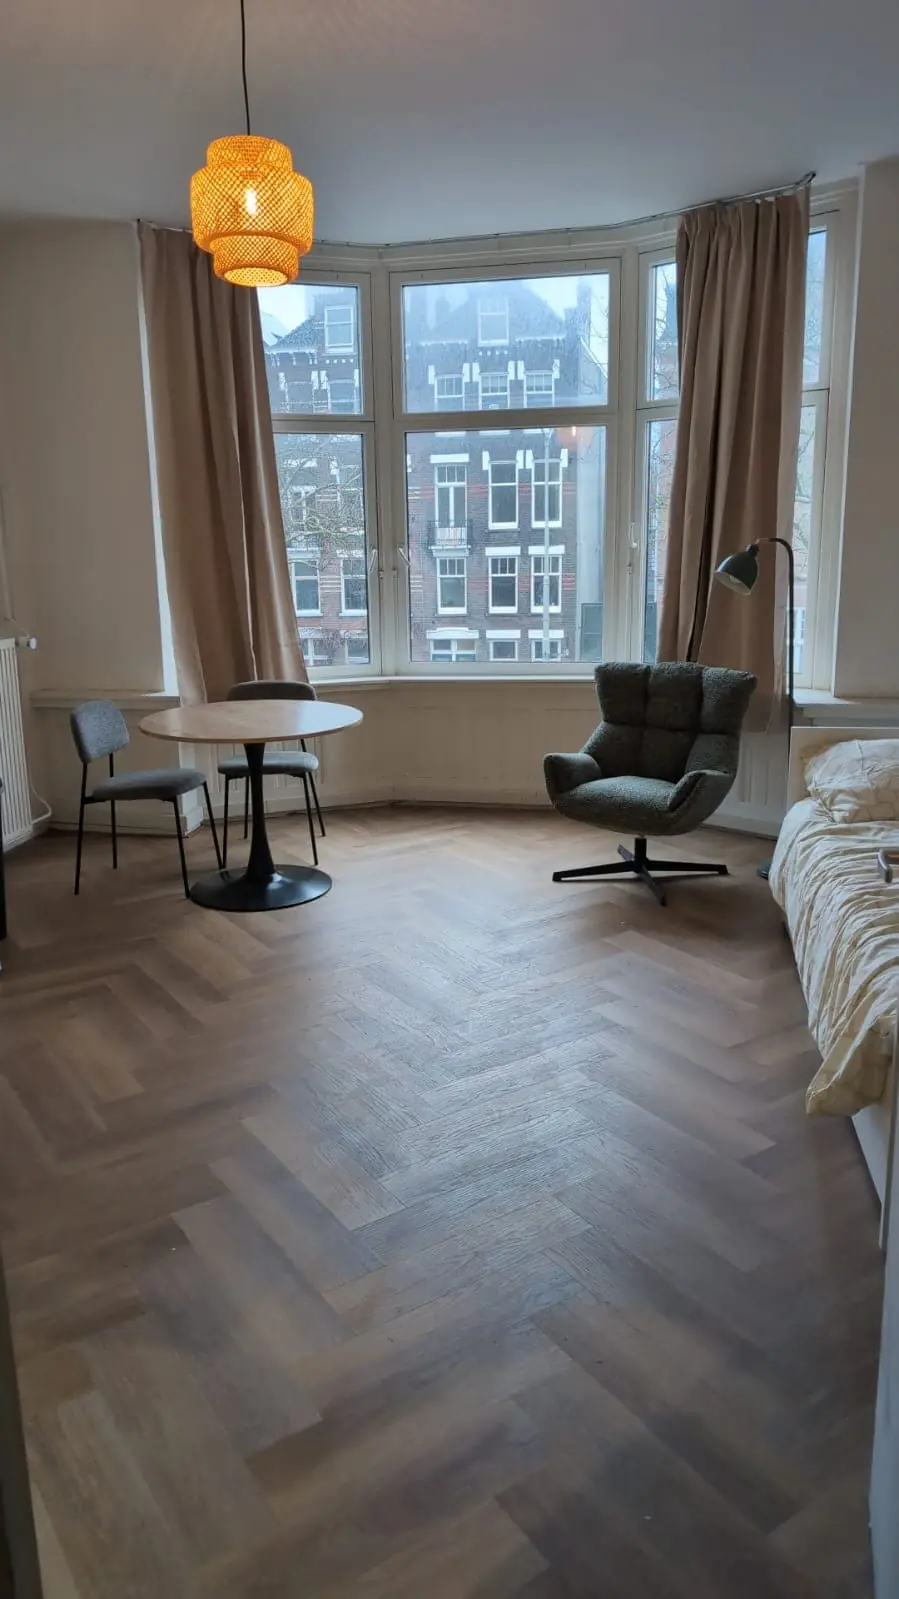
€1,193.00 / month
€940.00 / month
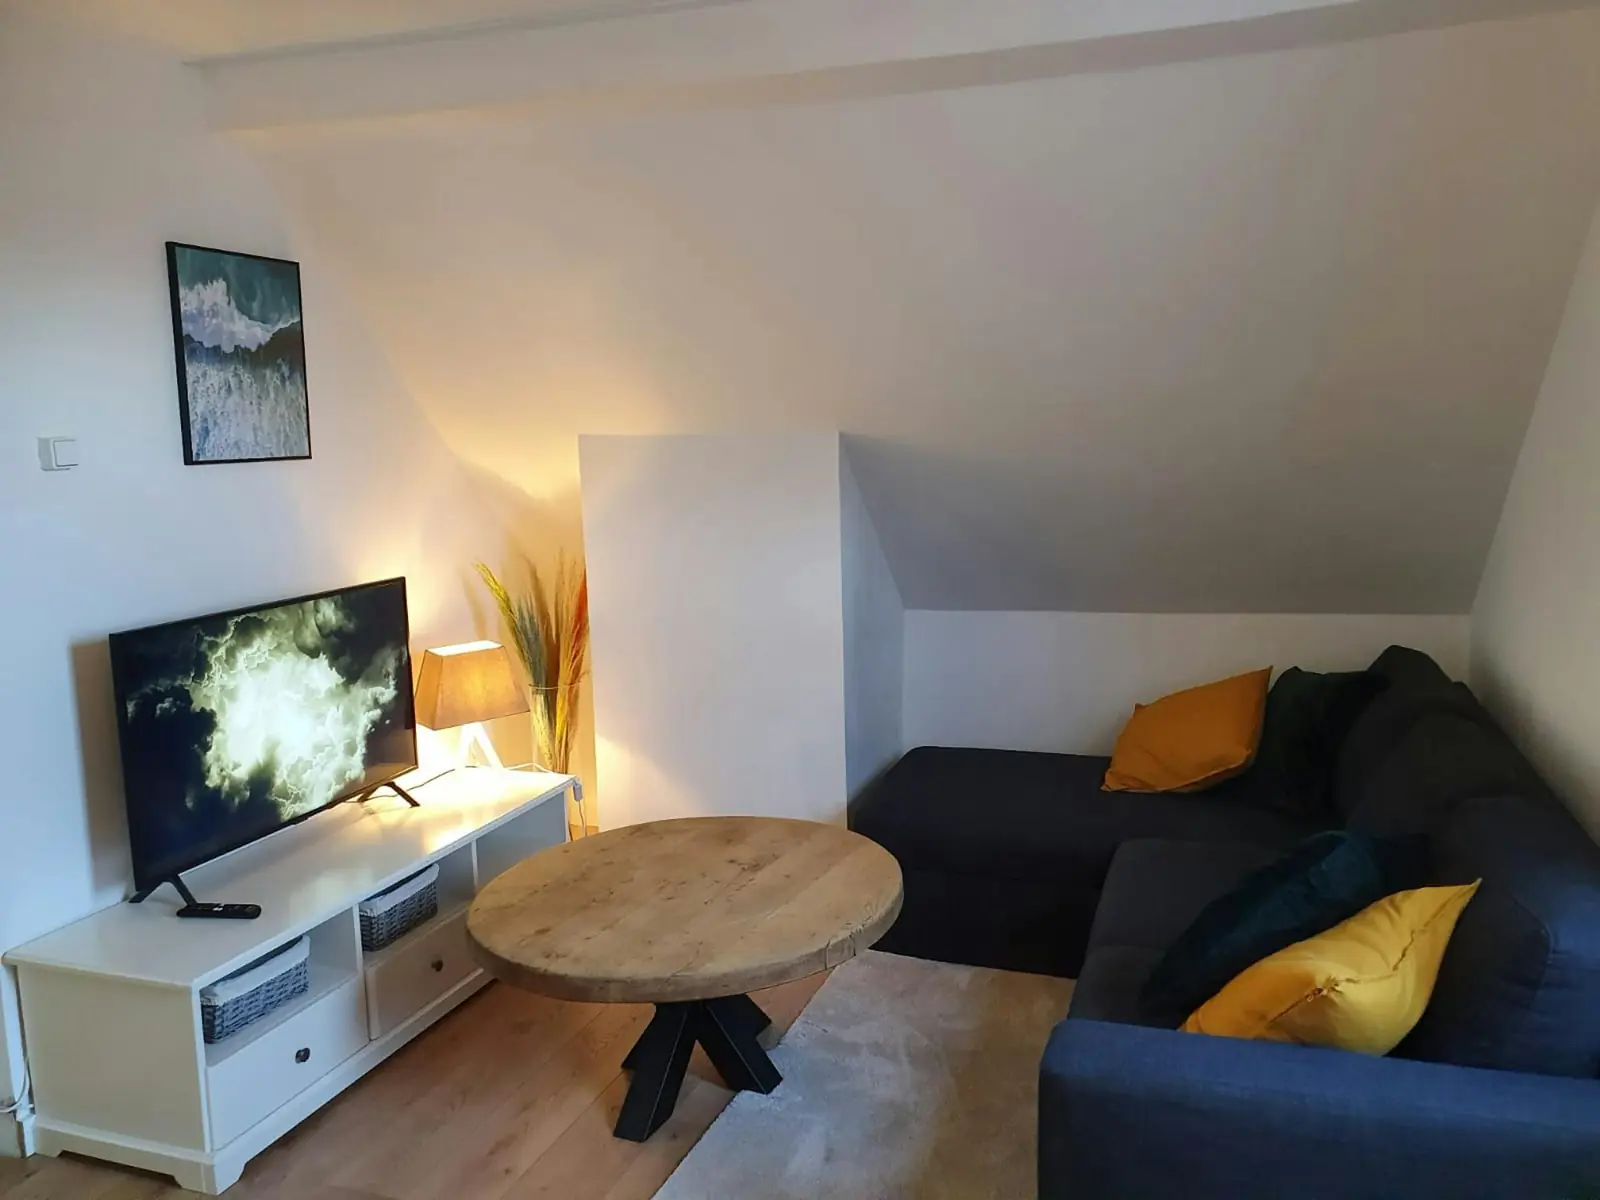
€2,400.00 / month
€714.00 / month
| Band | Listings | Median size |
|---|---|---|
| <20 | 38 | 67 m² |
| 20–30 | 7 | 25 m² |
| 30–40 | 5 | 23 m² |
| 40–50 | 0 | – |
| 50–60 | 2 | 10 m² |
| 60–80 | 0 | – |
| 80–100 | 0 | – |
| 100+ | 0 | – |