
Rental market metrics
Median and average asking rent, price per square meter, time on market, supply volume and the rest of the indicator library.
Browse metricsNew listings volume shows how many fresh rental homes enter the market over time in Diemen. Ground any comparison from New Listings Volume in Diemen in the same property category, period, and method used by its source. It helps reveal whether supply is being replenished steadily or slowing down, which affects choice and competition for renters. The pattern is useful when read alongside broader market conditions and seasonal shifts.
Track how the number of newly advertised rentals changes across periods in Diemen. Rising inflow can point to improving choice and a more active market, while weaker inflow can signal tighter conditions even before total stock changes much. Short-term spikes should be read in context rather than treated as a lasting shift.
Figures come from the rental listings Luntero represents for the selected period. Sample sizes differ per location and month, so read short movements together with the underlying listing counts rather than as exact market wide changes.
New listings volume shows how many fresh rental homes enter the market over time in Diemen. It helps reveal whether supply is being replenished steadily or slowing down, which affects choice and competition for renters. The pattern is useful when read alongside broader market conditions and seasonal shifts.
Use New Listings Volume — Diemen to answer a defined local market question rather than treating one indicator as a complete verdict. Use observation count to frame New Listings Volume in Diemen, then inspect unit and geography before comparing results.
Higher new-listing flow usually improves renter choice and can ease pressure if demand does not rise just as fast.
A softer flow can tighten conditions even when total stock still looks stable, because fewer homes are being replenished.
Seasonal patterns matter, since rental listings often rise and fall in predictable waves across the year.
In Diemen, the pace of new supply is especially relevant because local demand is shaped by its link to the Amsterdam market.
Sudden jumps or dips are most useful when compared with earlier periods, not treated as a lasting market change on their own.
Use the trend to judge whether Diemen is being replenished fast enough for active renters.
Compare recent inflow with earlier periods to separate seasonal movement from a real supply shift.
Read the metric as a pressure signal: fewer new listings can tighten choice before stock visibly falls.
Place Diemen in the context of its Amsterdam-linked rental demand and commuter-market dynamics.
Focus on turnover and landlord release timing rather than assuming every change reflects a structural shift.
This page documents one indicator. The Diemen overview brings the median advertised rent, cost per square metre, three trend windows, listing supply and the bedroom, property-type and furnishing mix together in a single reading.
Stay in Diemen and switch the question. The same represented listing sample powers every metric and report below, so you can move from asking rent to price per square meter, supply, space and neighbourhood detail without losing the local context.
Compare New Listings Volume by Location across supported Dutch locations using the represented listing sample. Differences reflect the covered sources, period and methodology and should not be treated as complete local-market or demand measurements.
New Listings Volume in Diemen is most informative when period, sample, and time window are read together. Move from new listings volume in Diemen to the broader location comparison, and keep every value attached to its definition, period, aggregation, method, and available sample.
Median and average asking rent, price per square meter, time on market, supply volume and the rest of the indicator library.
Browse metricsMulti measure analyses of pricing, supply, composition, space, affordability and market speed across the Netherlands and its cities.
Browse reportsSee the apartments, rooms and houses currently advertised in Diemen and filter them by price, size and property type.
Search Diemen rentalsHave an idea for a new housing market chart, dataset, or analysis? Submit your request and help shape the next generation of Luntero’s rental market insights. Whether it’s a new metric, city comparison, or visualization, your input helps us expand coverage of Dutch housing trends and create data tools that serve renters, investors, and researchers across the Netherlands.
Explore the latest properties added to Luntero. Find new apartments, houses, and studios across the Netherlands — updated daily to help you discover your next home faster.
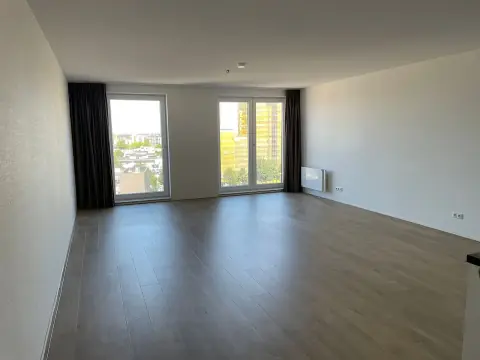
€1,159.00 / month

€600.00 / month
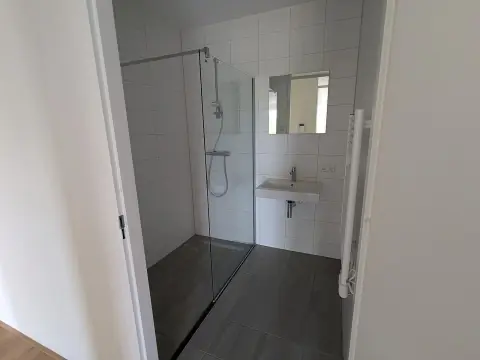
€932.00 / month

€1,187.00 / month
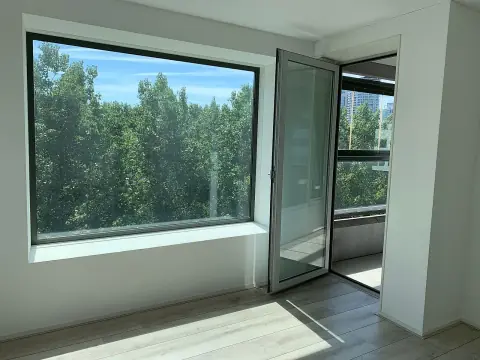
€1,845.00 / month
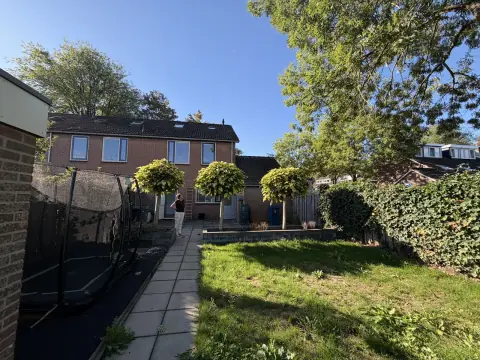
€933.00 / month

€1,899.00 / month
€765.00 / month
€714.00 / month

€1,596.00 / month
€714.00 / month

€1,210.00 / month