
Rental market metrics
Median and average asking rent, price per square meter, time on market, supply volume and the rest of the indicator library.
Browse metricsThe median rent shows the middle asking price in Heerenveen, making it a steadier reference point than an average when rents vary across property types. Median Rent in Heerenveen addresses a defined market question; property category, coverage, and observation count set the limits of the answer. It helps renters judge what a typical advertised home may cost and gives landlords and analysts a clearer view of the market’s central pricing level over time.
Compare how the median asking rent in Heerenveen changes across time periods to understand whether the typical market level is moving up, down, or holding steady. Treat short-term swings carefully, since changes in the mix of listed homes can affect the figure even when underlying pricing pressure is less dramatic.
Figures come from the rental listings Luntero represents for the selected period. Sample sizes differ per location and month, so read short movements together with the underlying listing counts rather than as exact market wide changes.
The median rent shows the middle asking price in Heerenveen, making it a steadier reference point than an average when rents vary across property types. It helps renters judge what a typical advertised home may cost and gives landlords and analysts a clearer view of the market’s central pricing level over time.
Open Median Rent — Heerenveen when you need one local indicator and the context required to compare it responsibly. Ground any comparison from Median Rent in Heerenveen in the same observation count, sample, and publication date used by its source.
The median rent is a practical benchmark for what a typical advertised home in Heerenveen may cost.
Because it uses the middle value, it is less affected by outliers than an average rent measure.
Changes in the median can signal broader pricing pressure even when individual listings vary widely.
Comparisons over time work best when read alongside the mix of homes being offered.
The measure is useful for renters checking affordability and for analysts tracking market direction.
Use the median as the baseline for judging whether Heerenveen feels expensive or accessible.
Compare the median with earlier periods to spot gradual pricing shifts rather than one-off spikes.
Read the figure as a market midpoint, not as the cost of every home on offer.
Use Heerenveen as a local reference within Fryslân without assuming it matches nearby towns.
Focus on the median when discussing affordability because it is more stable than an average.
This page documents one indicator. The Heerenveen overview brings the median advertised rent, cost per square metre, three trend windows, listing supply and the bedroom, property-type and furnishing mix together in a single reading.
Stay in Heerenveen and switch the question. The same represented listing sample powers every metric and report below, so you can move from asking rent to price per square meter, supply, space and neighbourhood detail without losing the local context.
Compare Median Rent by Location across supported Dutch locations using the represented listing sample. Differences reflect the covered sources, period and methodology and should not be treated as complete local-market or demand measurements.
A defensible comparison of Median Rent in Heerenveen keeps period aligned with method and unit. Put the Heerenveen result for median rent beside compatible Dutch locations, keeping the measure, time window, unit, method, and observed listing population aligned.
Median and average asking rent, price per square meter, time on market, supply volume and the rest of the indicator library.
Browse metricsMulti measure analyses of pricing, supply, composition, space, affordability and market speed across the Netherlands and its cities.
Browse reportsSee the apartments, rooms and houses currently advertised in Heerenveen and filter them by price, size and property type.
Search Heerenveen rentalsHave an idea for a new housing market chart, dataset, or analysis? Submit your request and help shape the next generation of Luntero’s rental market insights. Whether it’s a new metric, city comparison, or visualization, your input helps us expand coverage of Dutch housing trends and create data tools that serve renters, investors, and researchers across the Netherlands.
Explore the latest properties added to Luntero. Find new apartments, houses, and studios across the Netherlands — updated daily to help you discover your next home faster.
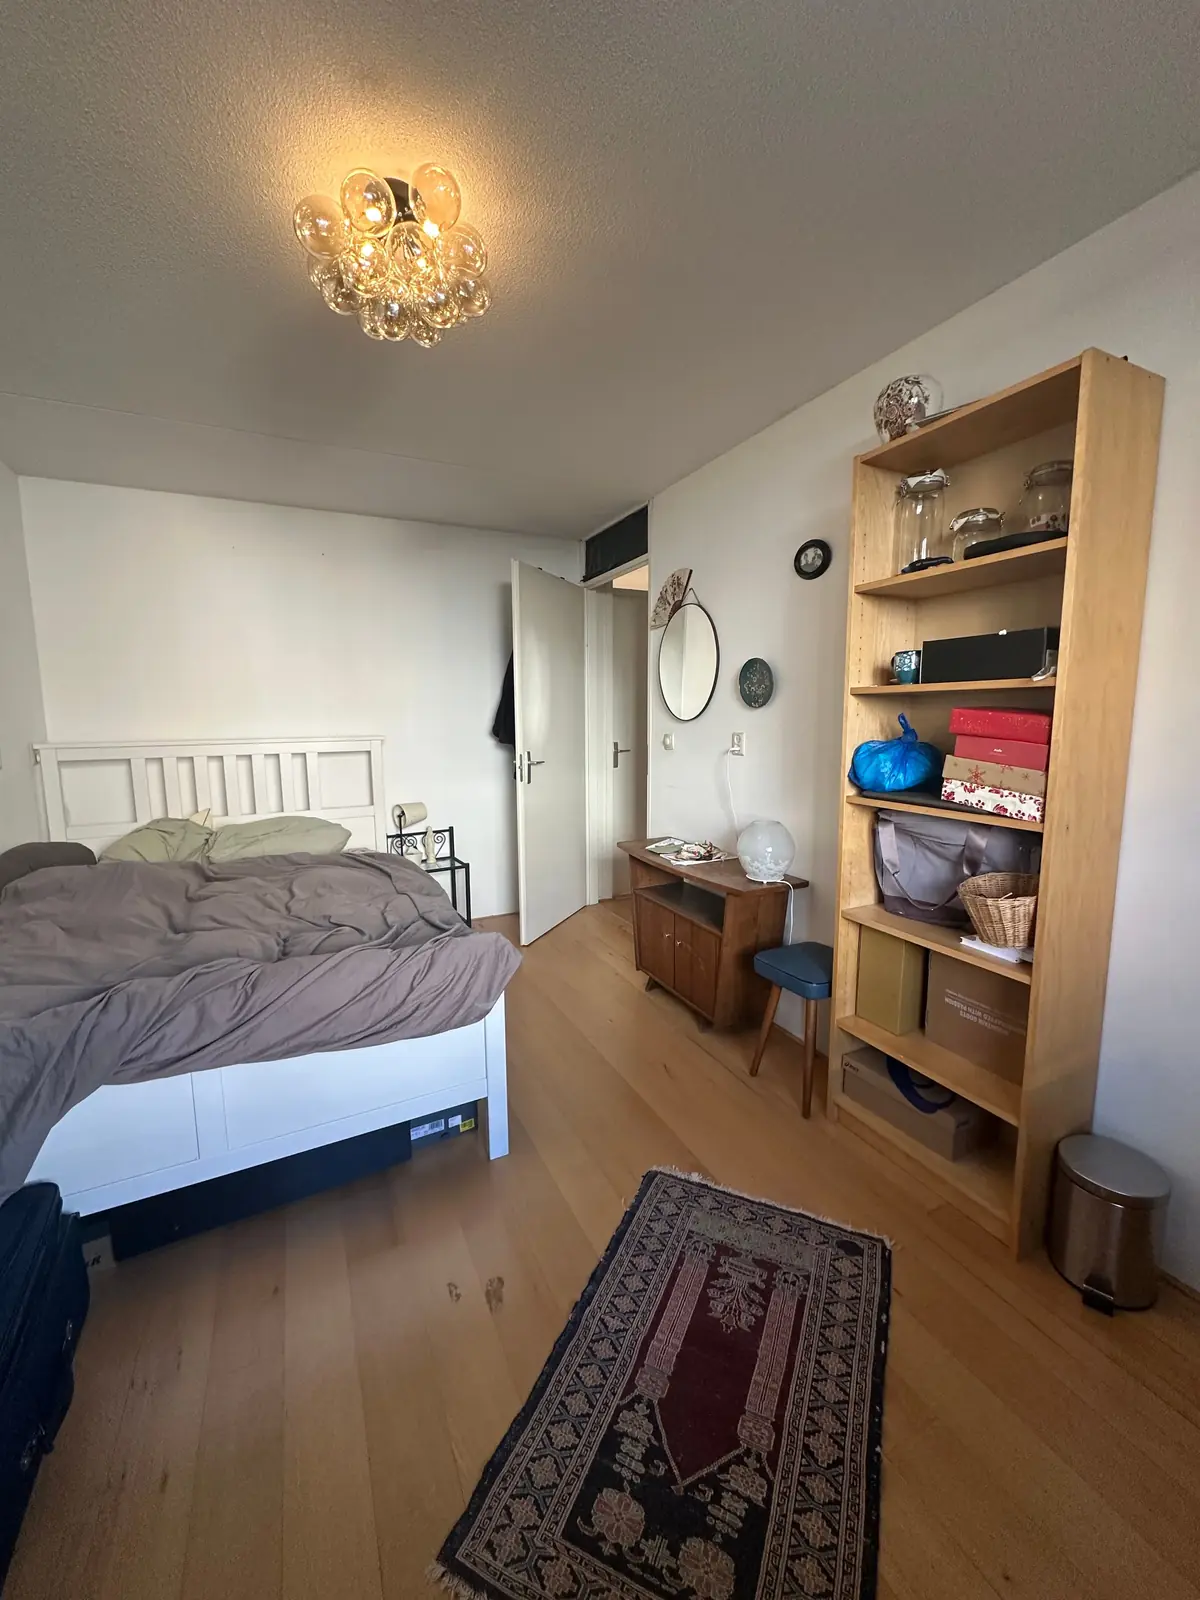
€1,350.00 / month
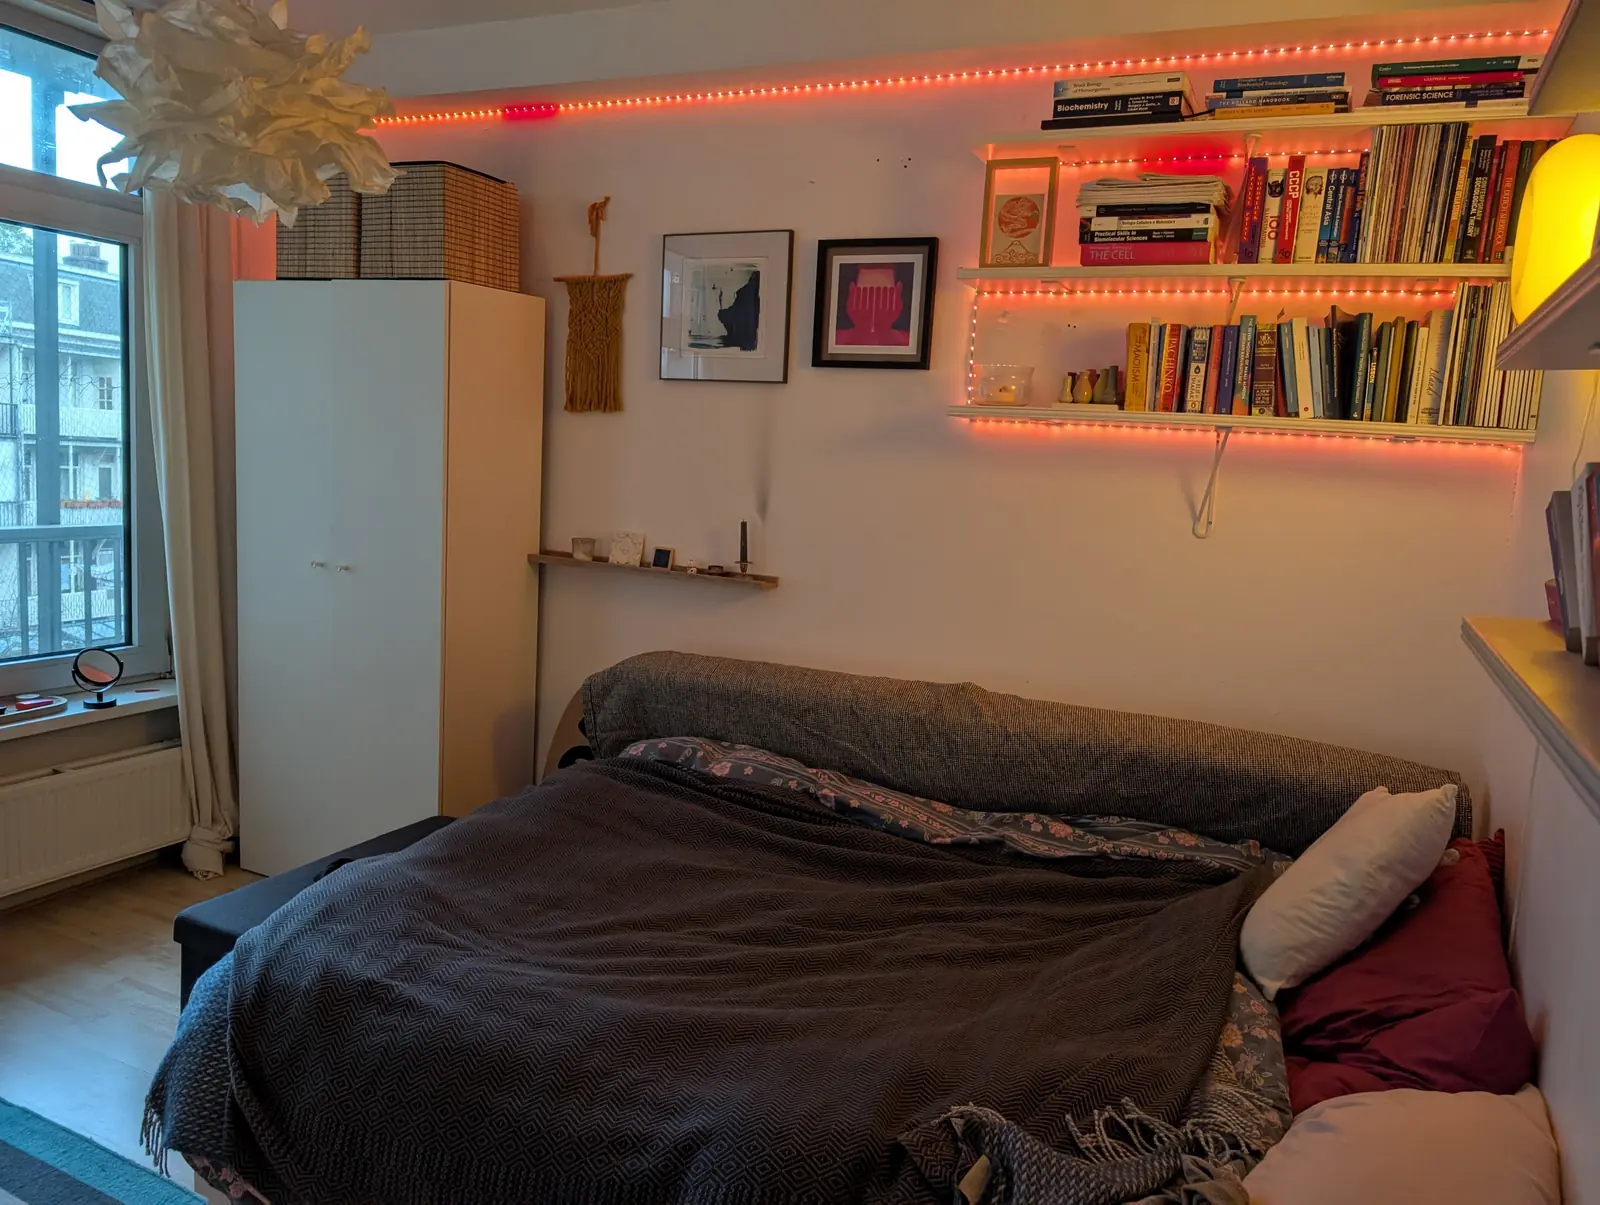
€952.00 / month
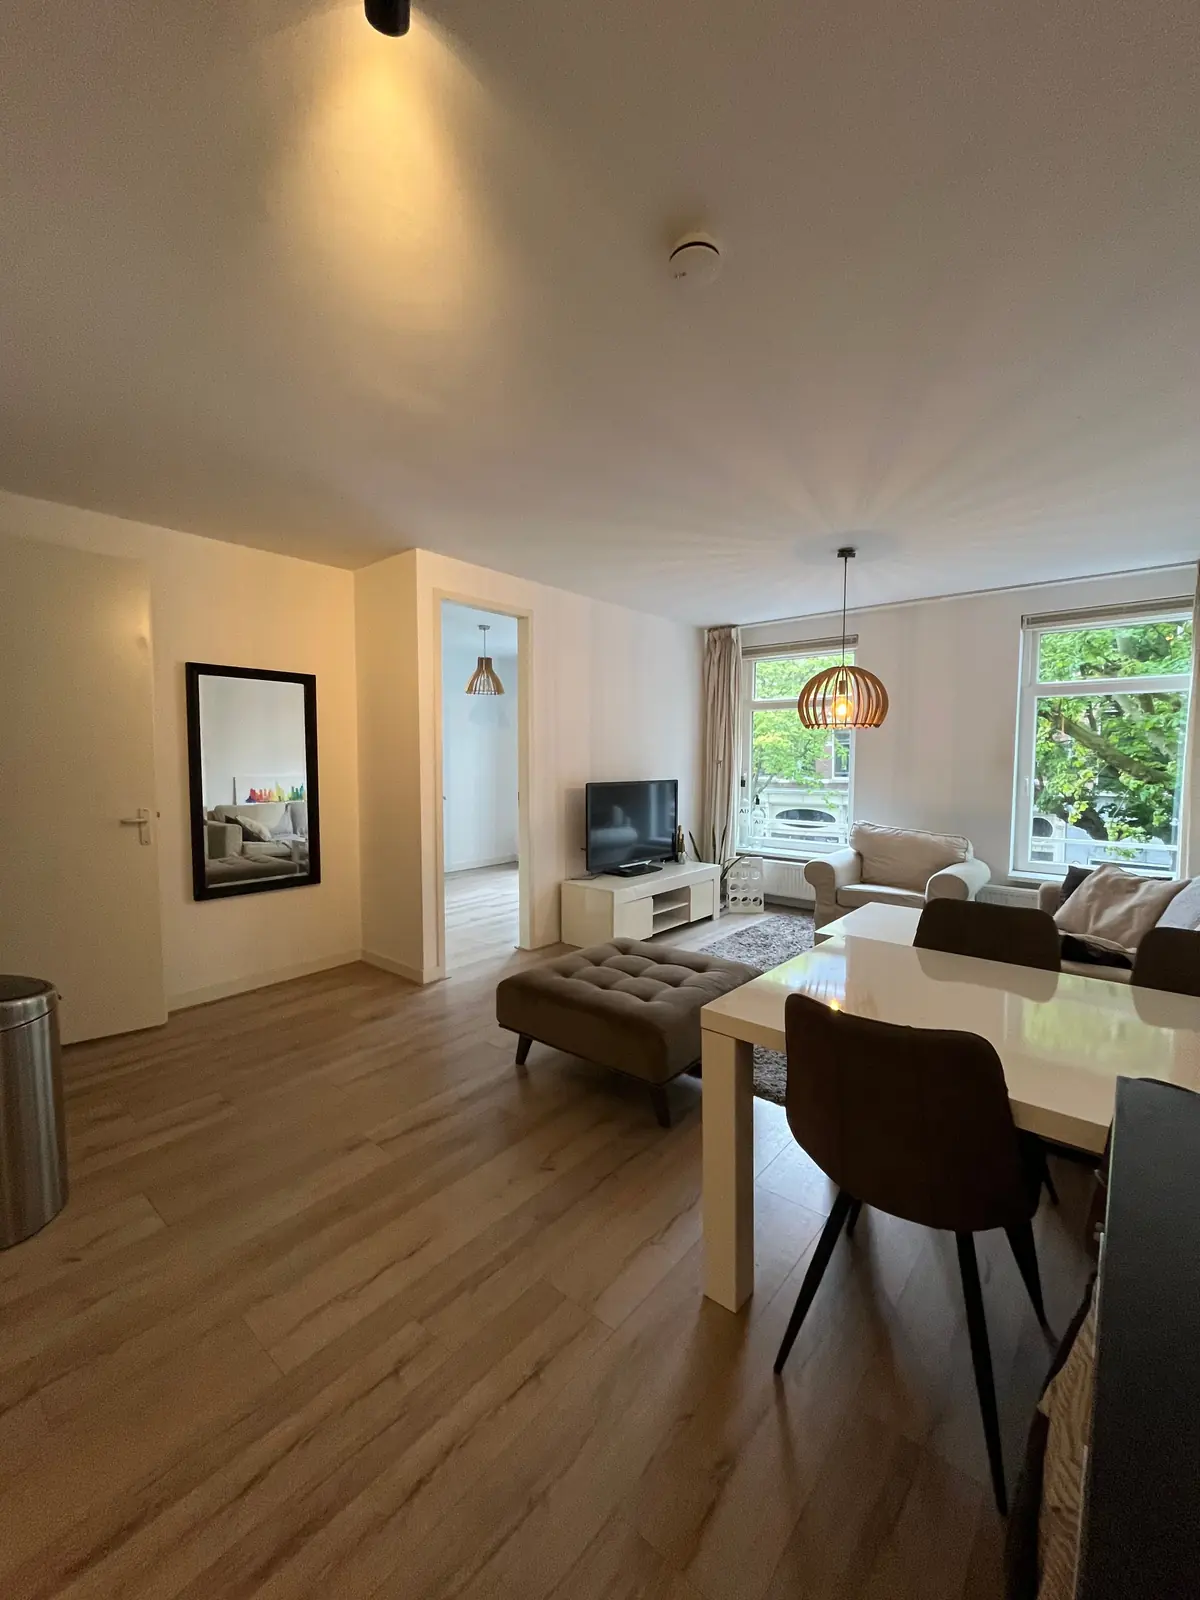
€1,100.00 / month
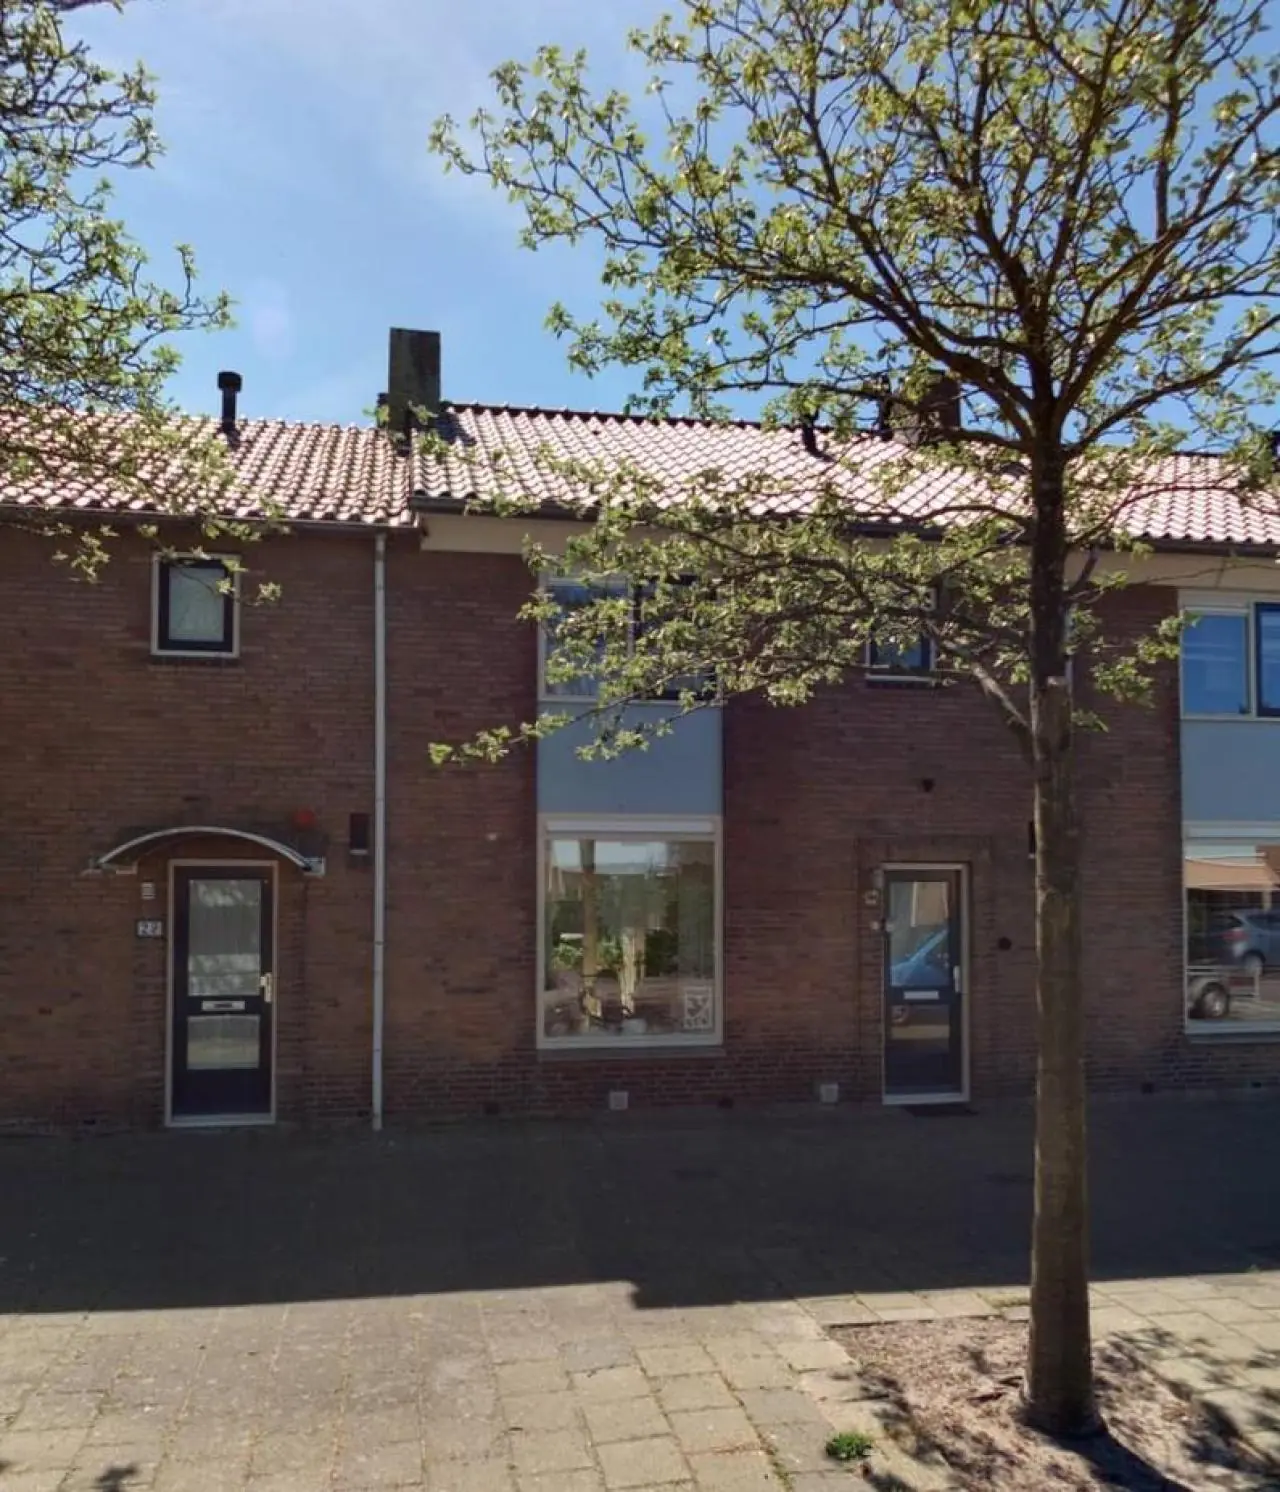
€765.00 / month
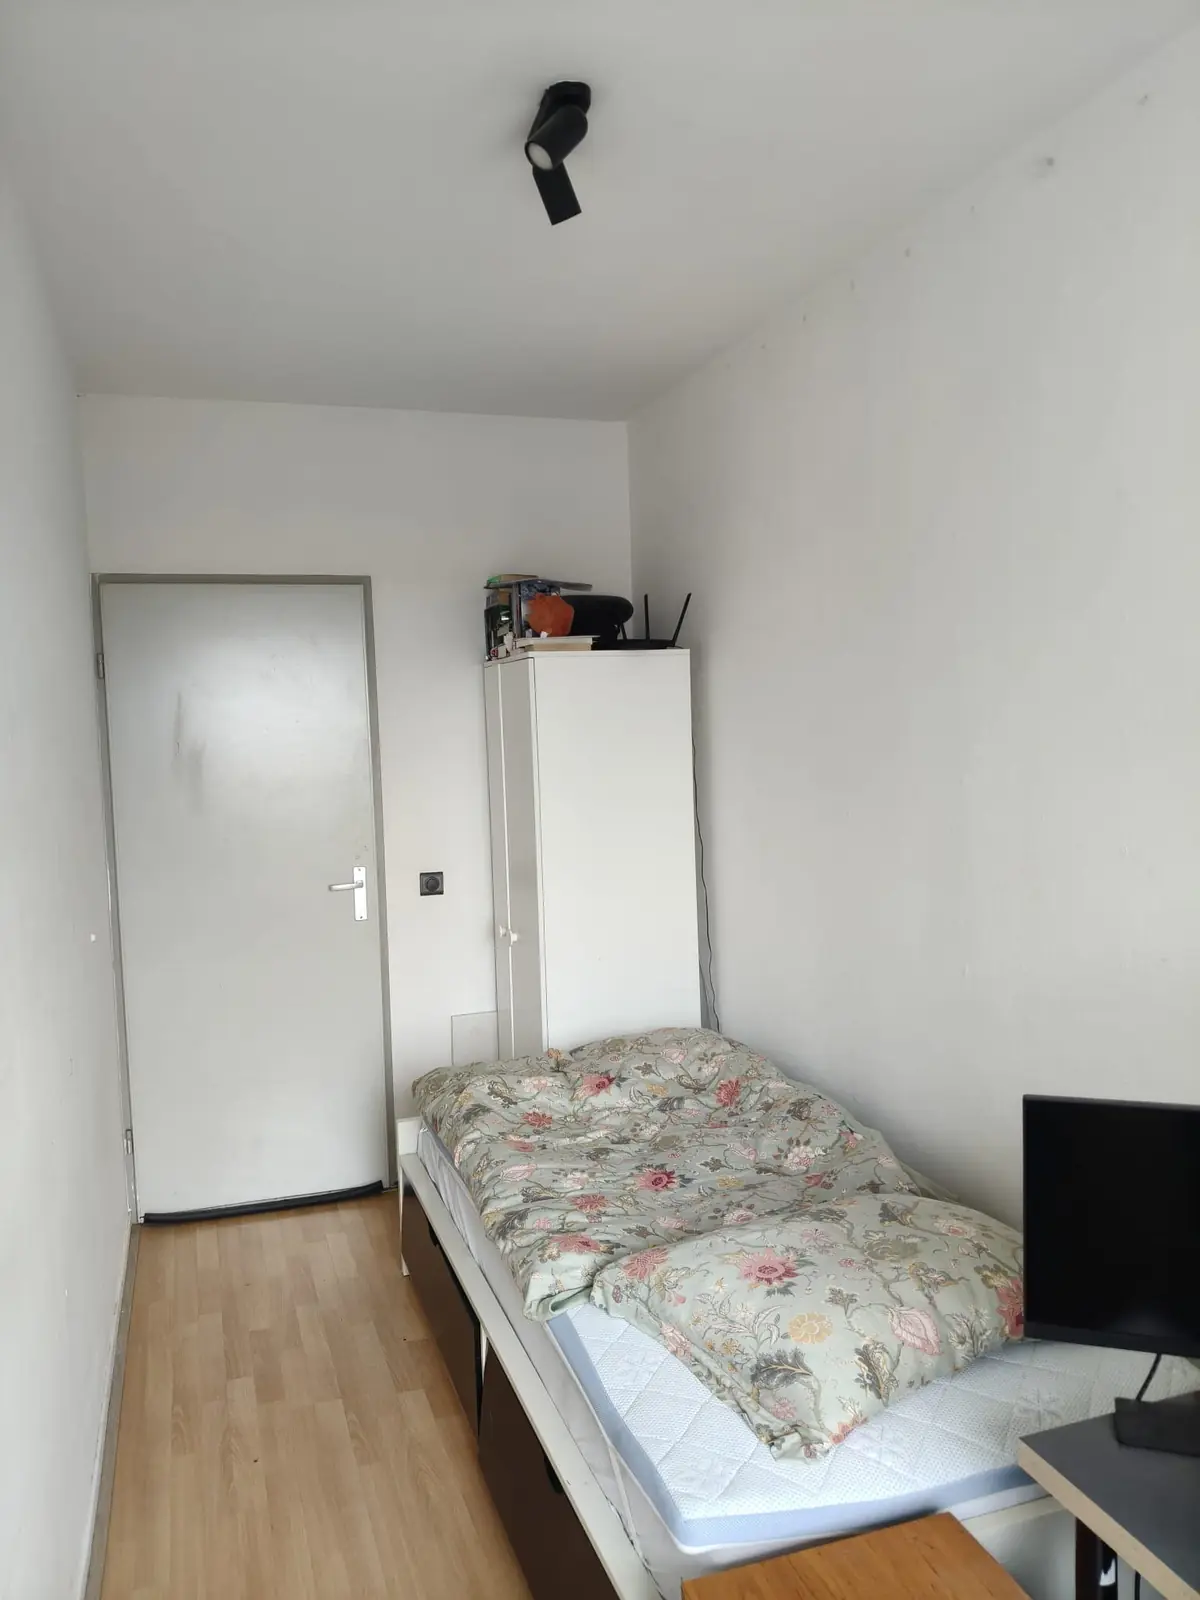
€700.00 / month
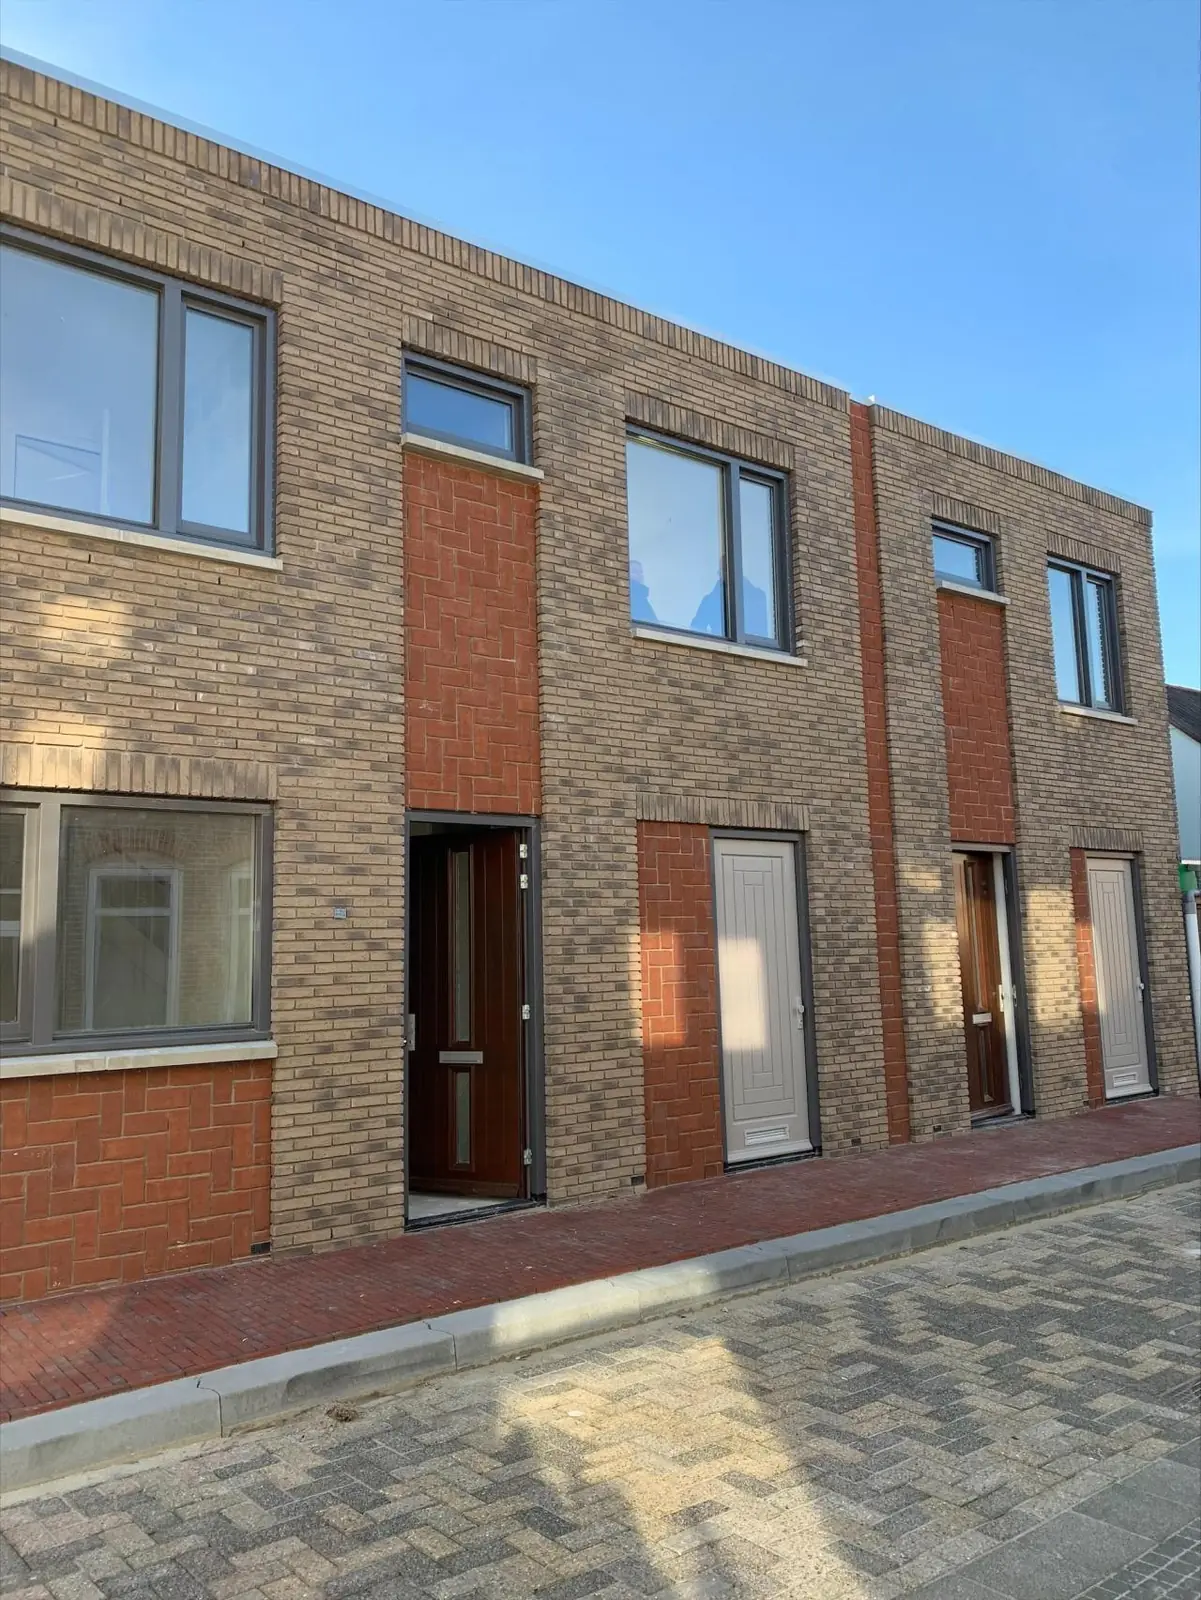
€933.00 / month
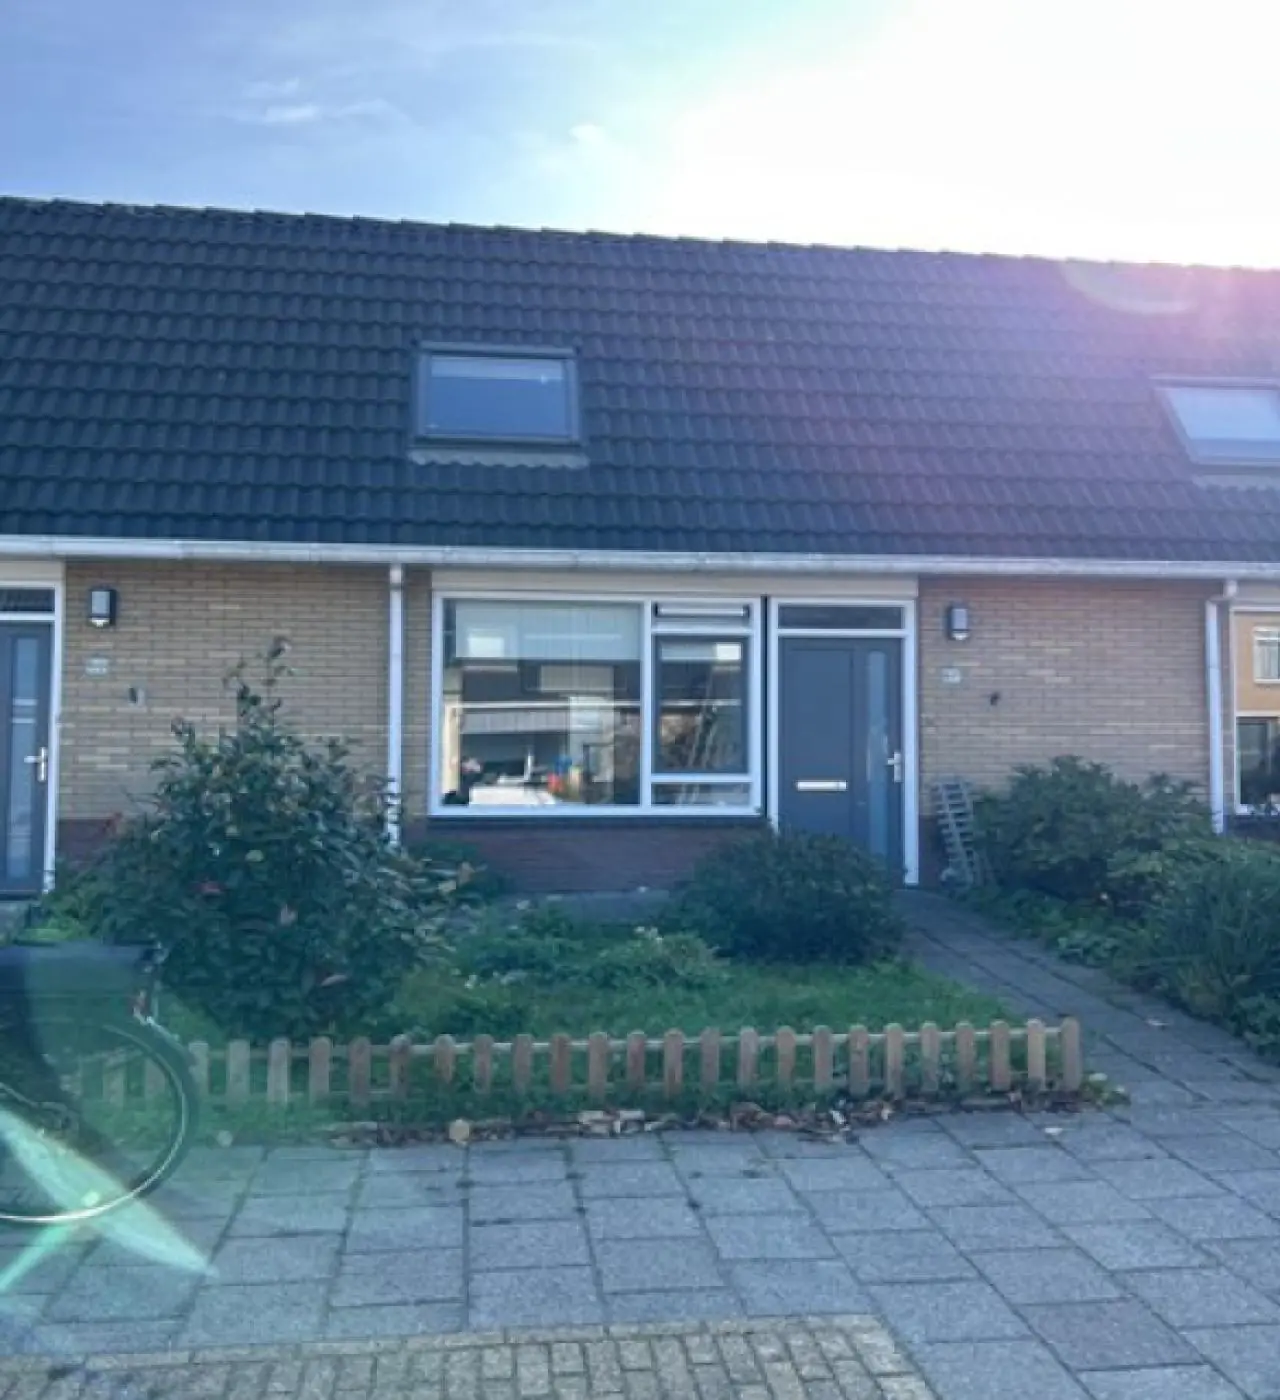
€765.00 / month
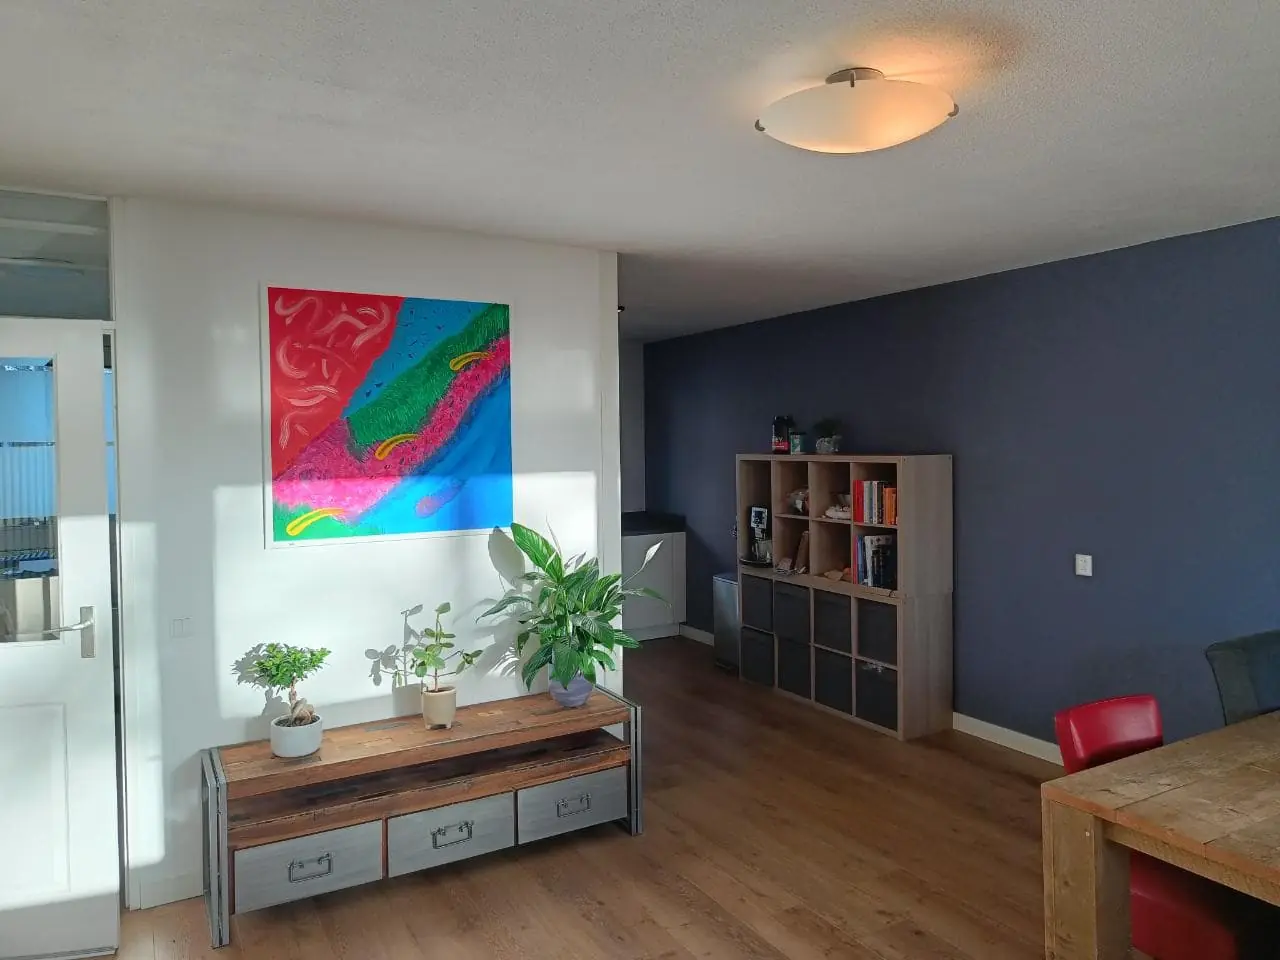
€975.00 / month
€765.00 / month

€2,450.00 / month
€2,350.00 / month
€725.00 / month