Luntero LogoLUNTERO
Luntero Market Data

Rental Listings by Bedroom Count in Leiden – Market Composition by Size

See how the number of available rentals in Leiden changes by bedroom count and which sizes lead the market. Discover whether smaller or larger apartments dominate today’s supply and how that affects choice. Luntero’s insights show the most common sizes and how availability shifts across seasons.

Active Listings by Bedroom Count in Leiden
Track how the number of available rentals in Leiden changes by bedroom size. Visualize supply distribution across months to spot housing trends.

Explore Listings by Bedrooms in Other Dutch Cities

Compare Listings by Bedrooms trends across major cities in the Netherlands and see how local housing markets differ. Luntero’s live rental data covers Amsterdam, Rotterdam, Utrecht, The Hague, and many more urban areas. Discover regional variations in rent prices, property types, and market demand across the Dutch housing landscape.

Listings by Bedroom Count in Amsterdam – Housing Supply Breakdown
See how rental listings in Amsterdam are distributed by bedroom count. Luntero tracks active supply to show which apartment sizes are most available.
Listings by Bedroom Count in Rotterdam – Housing Supply Breakdown
See how rental listings in Rotterdam are distributed by bedroom count. Luntero tracks active supply to show which apartment sizes are most available.
Listings by Bedroom Count in Den Haag – Housing Supply Breakdown
See how rental listings in Den Haag are distributed by bedroom count. Luntero tracks active supply to show which apartment sizes are most available.
Listings by Bedroom Count in Groningen – Housing Supply Breakdown
See how rental listings in Groningen are distributed by bedroom count. Luntero tracks active supply to show which apartment sizes are most available.
Listings by Bedroom Count in Utrecht – Housing Supply Breakdown
See how rental listings in Utrecht are distributed by bedroom count. Luntero tracks active supply to show which apartment sizes are most available.
Listings by Bedroom Count in Eindhoven – Housing Supply Breakdown
See how rental listings in Eindhoven are distributed by bedroom count. Luntero tracks active supply to show which apartment sizes are most available.
Listings by Bedroom Count in Maastricht – Housing Supply Breakdown
See how rental listings in Maastricht are distributed by bedroom count. Luntero tracks active supply to show which apartment sizes are most available.
Listings by Bedroom Count in Enschede – Housing Supply Breakdown
See how rental listings in Enschede are distributed by bedroom count. Luntero tracks active supply to show which apartment sizes are most available.
Listings by Bedroom Count in Tilburg – Housing Supply Breakdown
See how rental listings in Tilburg are distributed by bedroom count. Luntero tracks active supply to show which apartment sizes are most available.
Listings by Bedroom Count in Delft – Housing Supply Breakdown
See how rental listings in Delft are distributed by bedroom count. Luntero tracks active supply to show which apartment sizes are most available.
Listings by Bedroom Count in Breda – Housing Supply Breakdown
See how rental listings in Breda are distributed by bedroom count. Luntero tracks active supply to show which apartment sizes are most available.
Listings by Bedroom Count in Arnhem – Housing Supply Breakdown
See how rental listings in Arnhem are distributed by bedroom count. Luntero tracks active supply to show which apartment sizes are most available.

Explore More Rental Market Metrics

Discover more data-driven insights into the Dutch housing market with Luntero’s comprehensive collection of rental analytics. Explore trends in rent prices, housing supply, and market demand across cities to better understand how the Netherlands’ rental market evolves over time.

See All Metrics
Average Rent Trends in the Netherlands
Explore how average rent prices are changing across the Netherlands. Luntero analyzes thousands of verified listings to reveal real housing market trends by city.
Median Rent Prices in the Netherlands
See what tenants typically pay across Dutch cities. Luntero tracks median rent data each month to reveal realistic housing costs and market shifts.
Rental Price per m² in the Netherlands
Understand how much rent per square meter costs across Dutch cities. Luntero tracks price-per-m² trends to reveal space value in the housing market.
Average Time on Market for Rentals in the Netherlands
See how long rental listings stay online before being rented out. Luntero measures average days on market to reveal demand across Dutch cities.
Average Rent by Bedroom Count in the Netherlands
Compare rent prices for studios, 1-bedroom, 2-bedroom and 3+ bedroom homes. Luntero visualizes how apartment size impacts monthly rent costs.
Average Rent by Property Type in the Netherlands
Compare rent prices between apartments, houses, and studios. Luntero highlights how property type affects monthly rental costs nationwide.

Request a New Market Metric or Insight

Have an idea for a new housing market chart, dataset, or analysis? Submit your request and help shape the next generation of Luntero’s rental market insights. Whether it’s a new metric, city comparison, or visualization, your input helps us expand coverage of Dutch housing trends and create data tools that serve renters, investors, and researchers across the Netherlands.

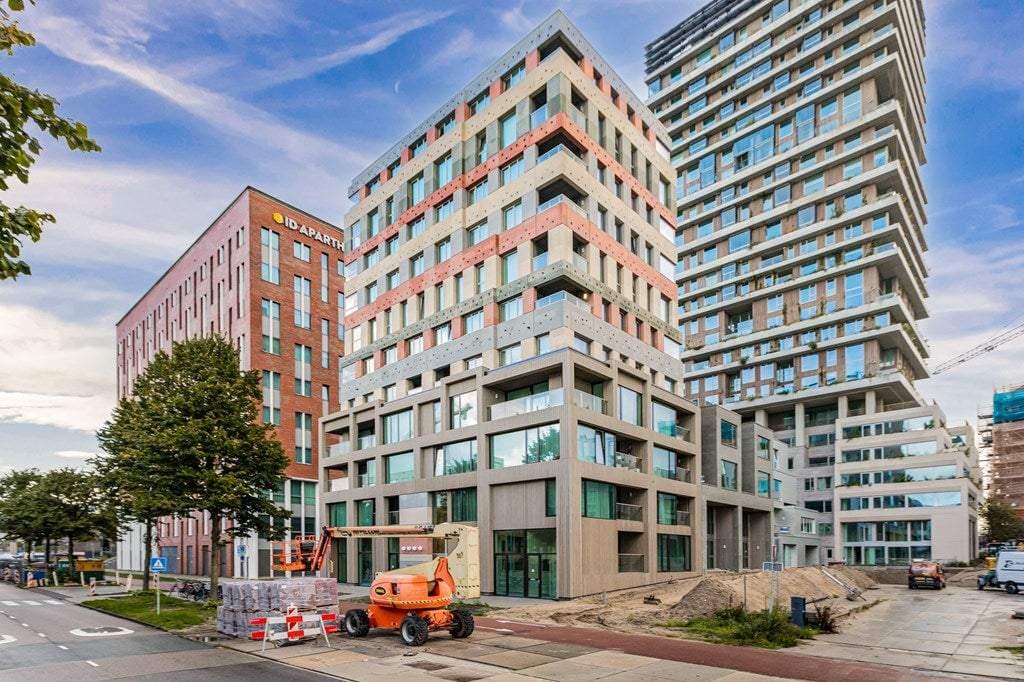
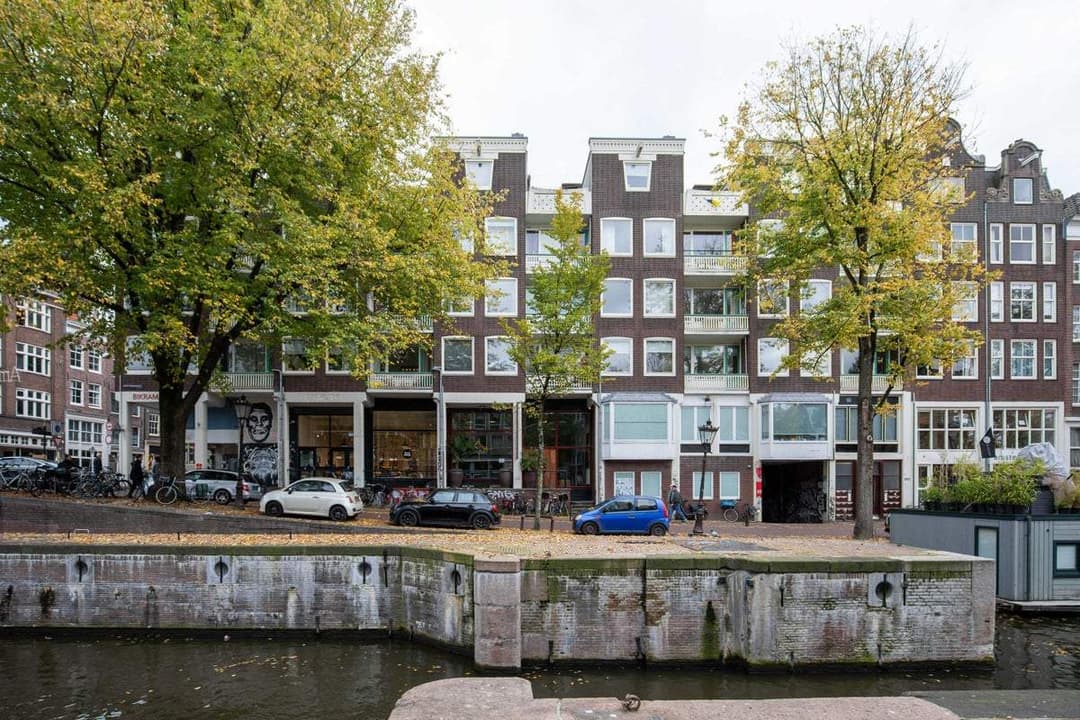
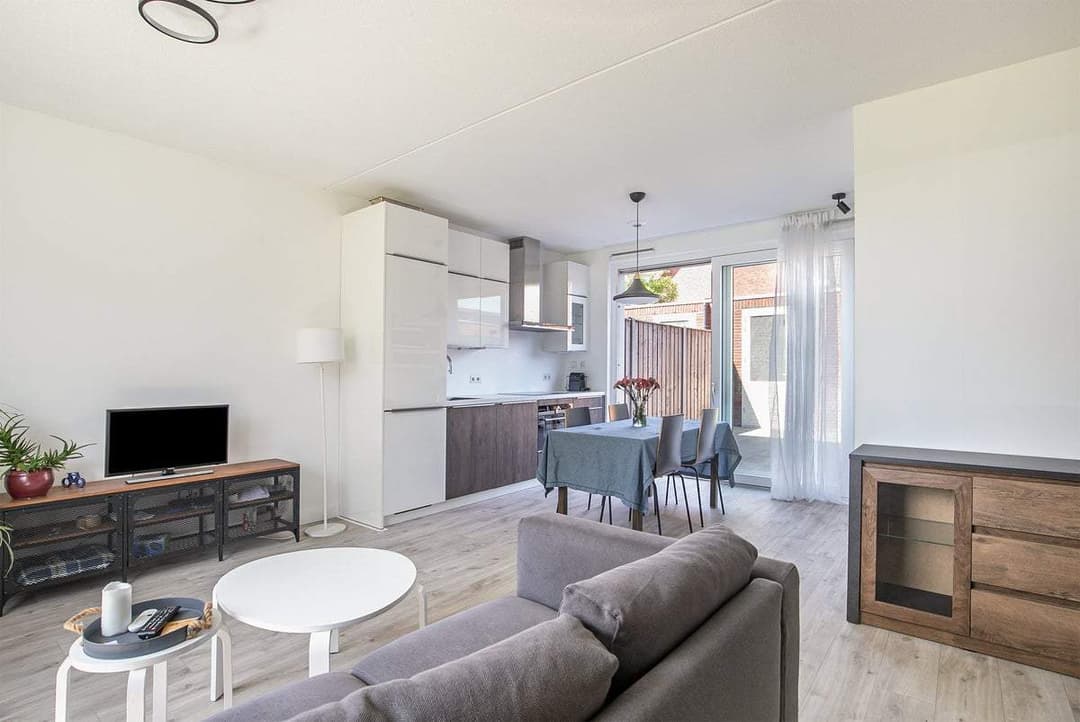
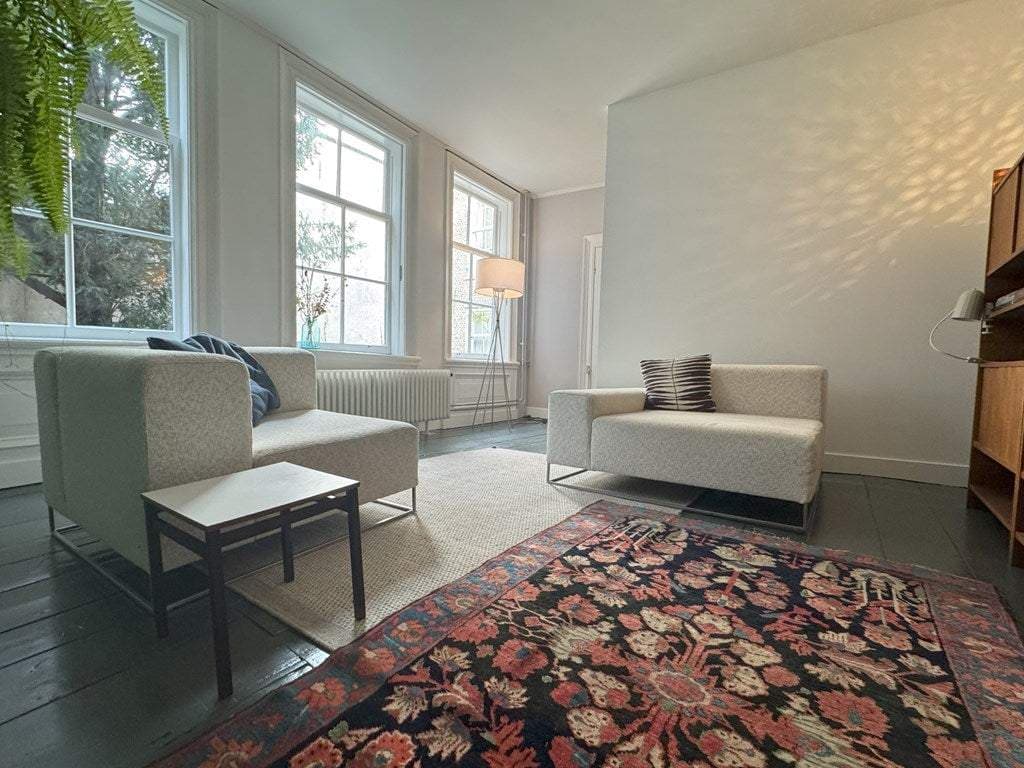
Newest Properties in the Netherlands

Explore the latest properties added to Luntero. Find new apartments, houses, and studios across the Netherlands — updated daily to help you discover your next home faster.

Mountain
Blob

© 2025 Luntero. All rights reserved.